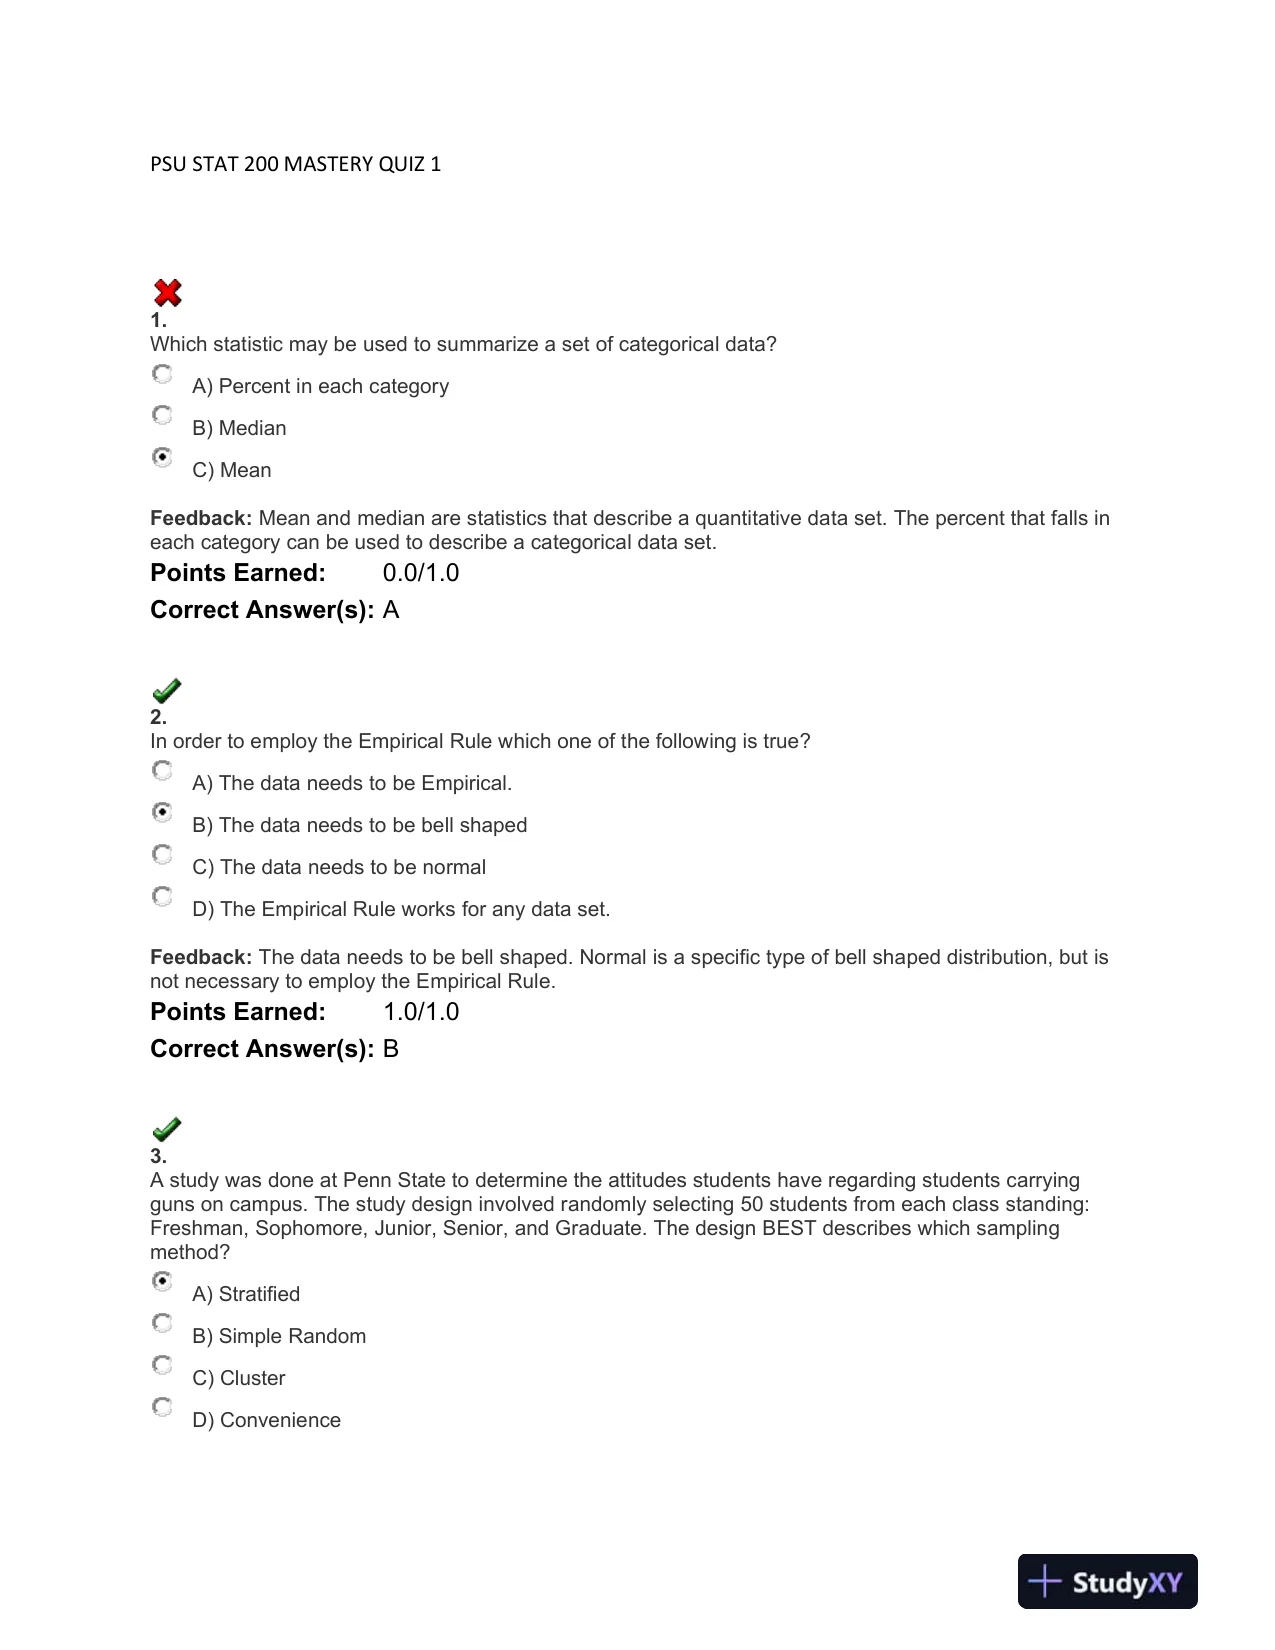
 PSU STAT 200 MASTERY QUIZ 11.Which statistic may be used to summarize a set of categorical data?A)Percent in each categoryB)MedianC)MeanFeedback:Mean and median are statistics that describe a quantitative data set. The percent thatfalls ineach category can be used to describe a categorical data set.Points Earned:0.0/1.0Correct Answer(s):A2.In order to employ the Empirical Rule which one of the following is true?A)The data needs to be Empirical.B)The dataneeds to be bell shapedC)The data needs to be normalD)The Empirical Rule works for any data set.Feedback:The data needs to be bell shaped. Normal is a specific type of bell shaped distribution, but isnot necessary to employ the Empirical Rule.Points Earned:1.0/1.0Correct Answer(s):B3.A study was done at Penn State to determine the attitudes students have regarding students carryingguns on campus. The study design involved randomly selecting 50 students from each classstanding:Freshman, Sophomore, Junior, Senior, and Graduate. The design BEST describes which samplingmethod?A)StratifiedB)Simple RandomC)ClusterD)Convenience
Preview Mode
This document has 12 pages. Sign in to access the full document!