
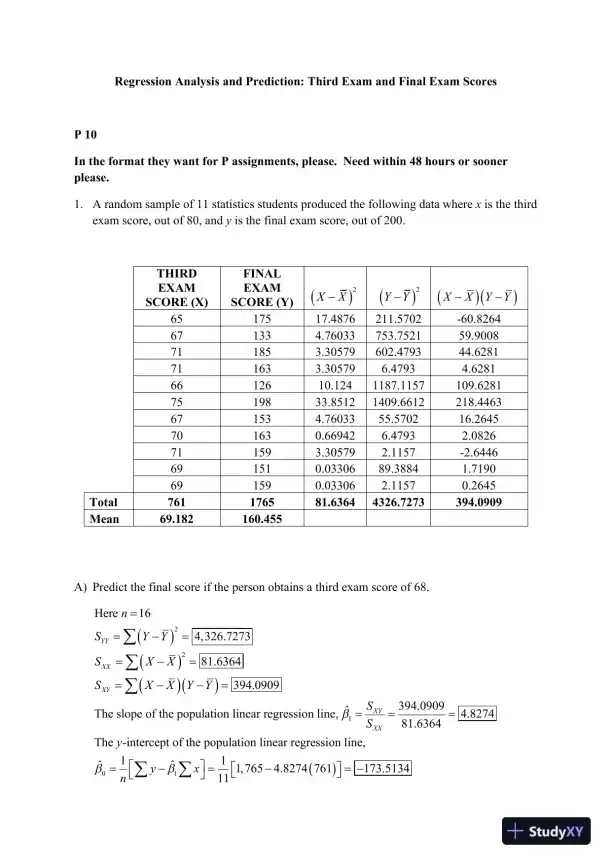
 Regression Analysis and Prediction: Third Exam and Final Exam ScoresP 10In the format they want for P assignments, please. Need within 48 hours or soonerplease.1.A random sample of 11 statistics students produced the following data wherexis the thirdexam score, out of 80, andyis the final exam score, out of 200.THIRDEXAMSCORE (X)FINALEXAMSCORE (Y)2XX2YYXXYY6517517.4876211.5702-60.8264671334.76033753.752159.9008711853.30579602.479344.6281711633.305796.47934.62816612610.1241187.1157109.62817519833.85121409.6612218.4463671534.7603355.570216.2645701630.669426.47932.0826711593.305792.1157-2.6446691510.0330689.38841.7190691590.033062.11570.2645Total761176581.63644326.7273394.0909Mean69.182160.455A)Predict the final score if the person obtains a third exam score of 68.221Here164,326.727381.6364394.0909394.0909ˆThe slope of the population linear regression line,4.827481.6364The-intercept of the population linear regressiYYXXXYXYXXnSYYSXXSXXYYSSy01on line,11ˆˆ1, 7654.8274 761173.513411yxn
 Regression Analysis and Prediction: Third Exam and Final Exam Scores
Examines regression analysis in predicting exam performance.
Amelia Ward
Contributor
4.3
0
12 months ago
Preview (2 of 2 Pages)
100%
Log in to unlock
Study Now!
X-Copilot AI
Unlimited Access
Secure Payment
Instant Access
24/7 Support
Document Chat
Document Details
Subject
Statistics