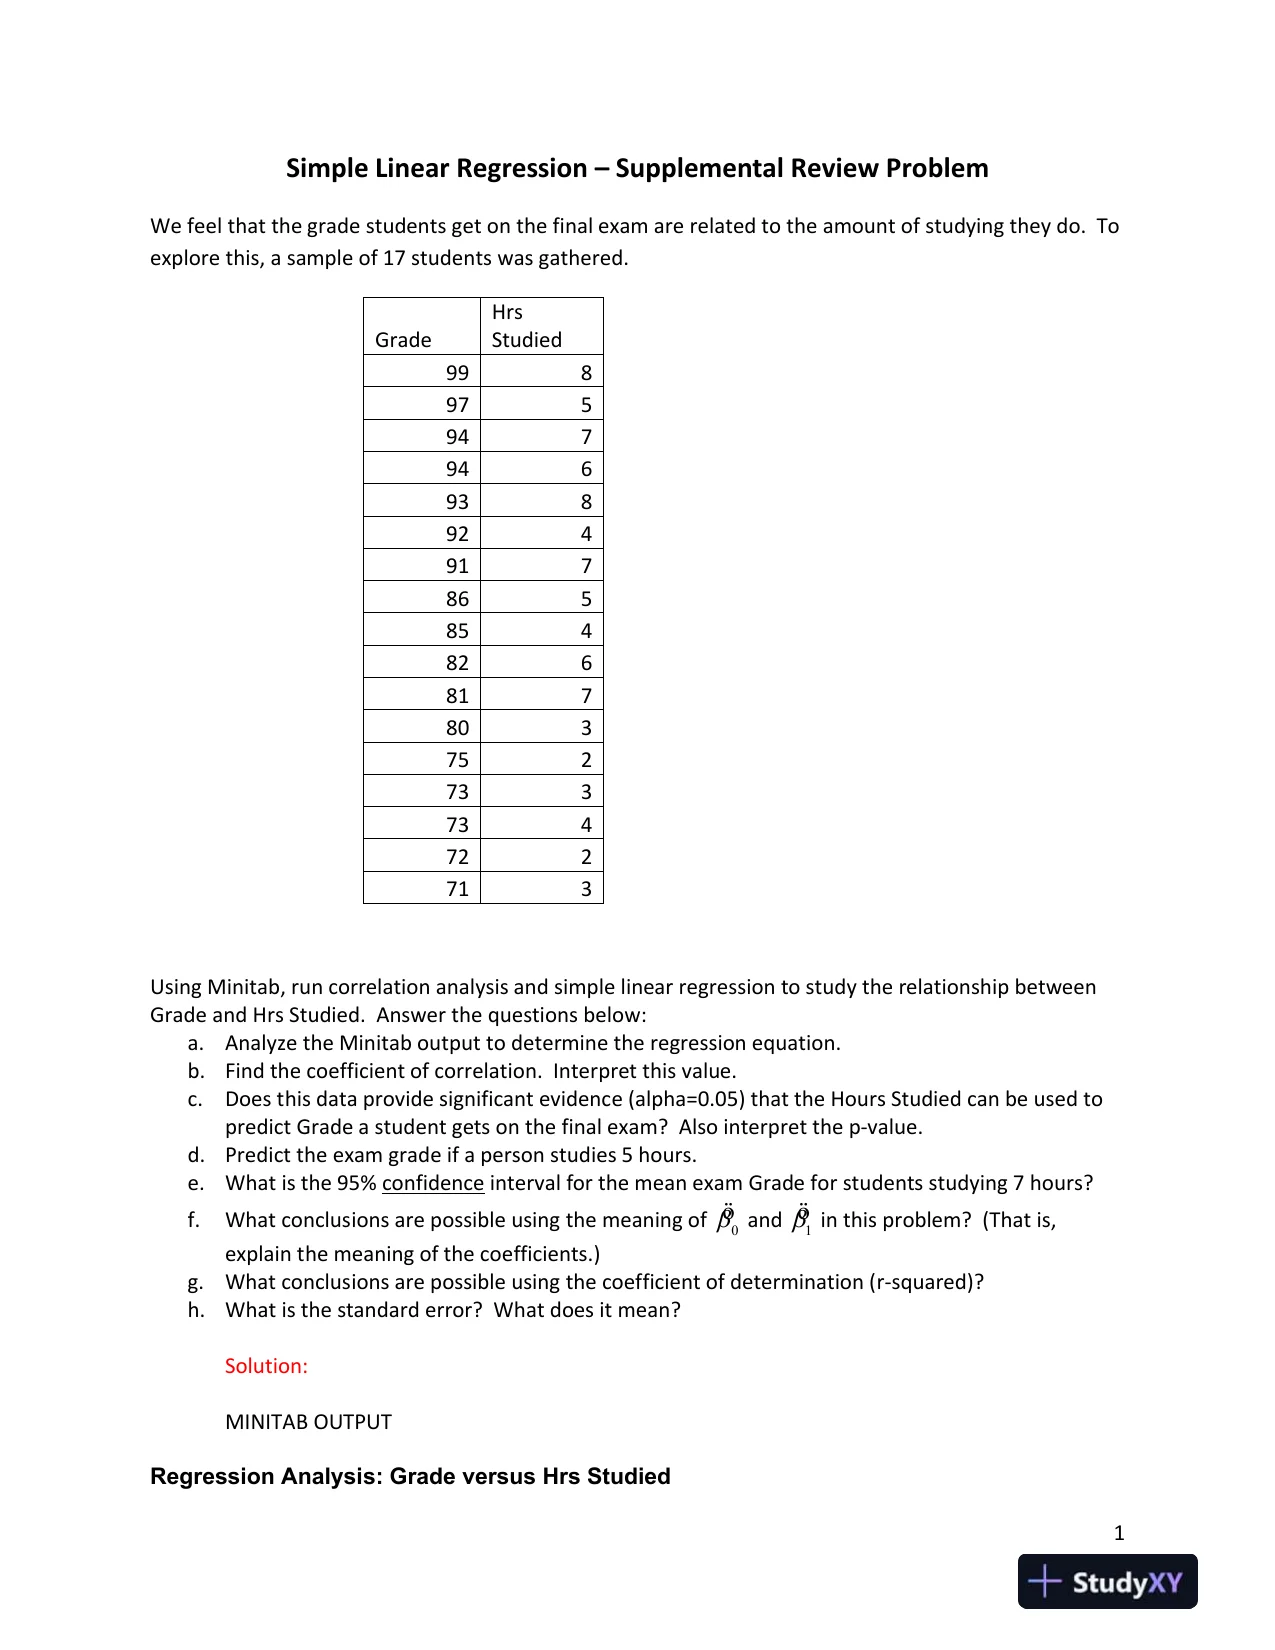
 1SimpleLinear Regression–SupplementalReviewProblemWe feel that the grade students get on the final exam are related to the amount of studying they do.Toexplore this, a sample of 17 students was gathered.GradeHrsStudied998975947946938924917865854826817803752733734722713Using Minitab, runcorrelation analysis andsimple linear regression to study the relationship betweenGrade and Hrs Studied. Answer the questions below:a.Analyze theMinitaboutput to determine the regression equation.b.Findthe coefficient of correlation.Interpret this value.c.Does this data provide significant evidence (alpha=0.05) that the Hours Studiedcan be used topredict Grade a student gets on the finalexam?Also interpret the p-value.d.Predict the exam grade if a person studies 5 hours.e.What is the 95%confidenceinterval for themeanexam Gradefor students studying7 hours?f.What conclusions are possible using the meaning ofö0andö1in this problem?(That is,explain the meaning of the coefficients.)g.What conclusions are possible using the coefficient of determination (r-squared)?h.What is the standard error? What does it mean?Solution:MINITAB OUTPUTRegression Analysis: Grade versus Hrs Studied
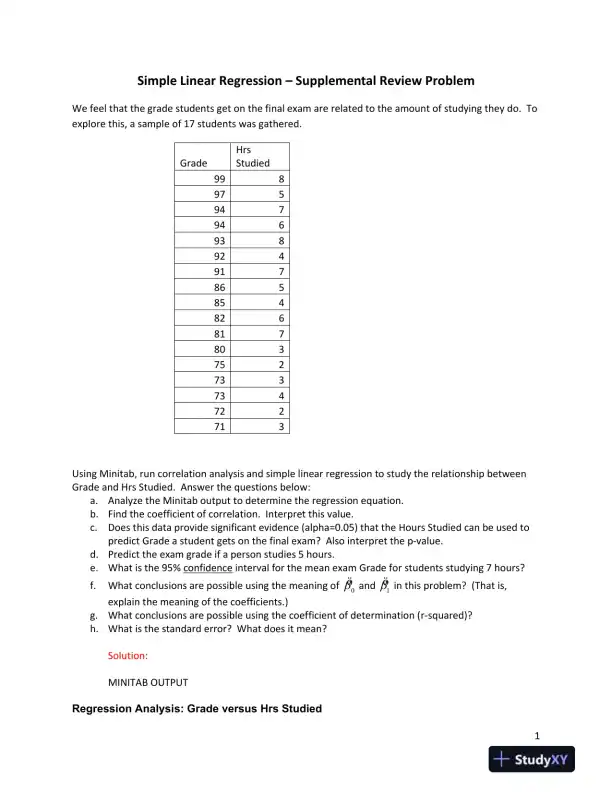
Simple Linear Regression � Supplemental Review Problem
Review of simple linear regression concepts with applied problems.
Amelia Ward
Contributor
4.3
0
12 months ago
Preview (2 of 2 Pages)
100%
Log in to unlock
Study Now!
X-Copilot AI
Unlimited Access
Secure Payment
Instant Access
24/7 Support
Document Chat
Document Details
Subject
Statistics