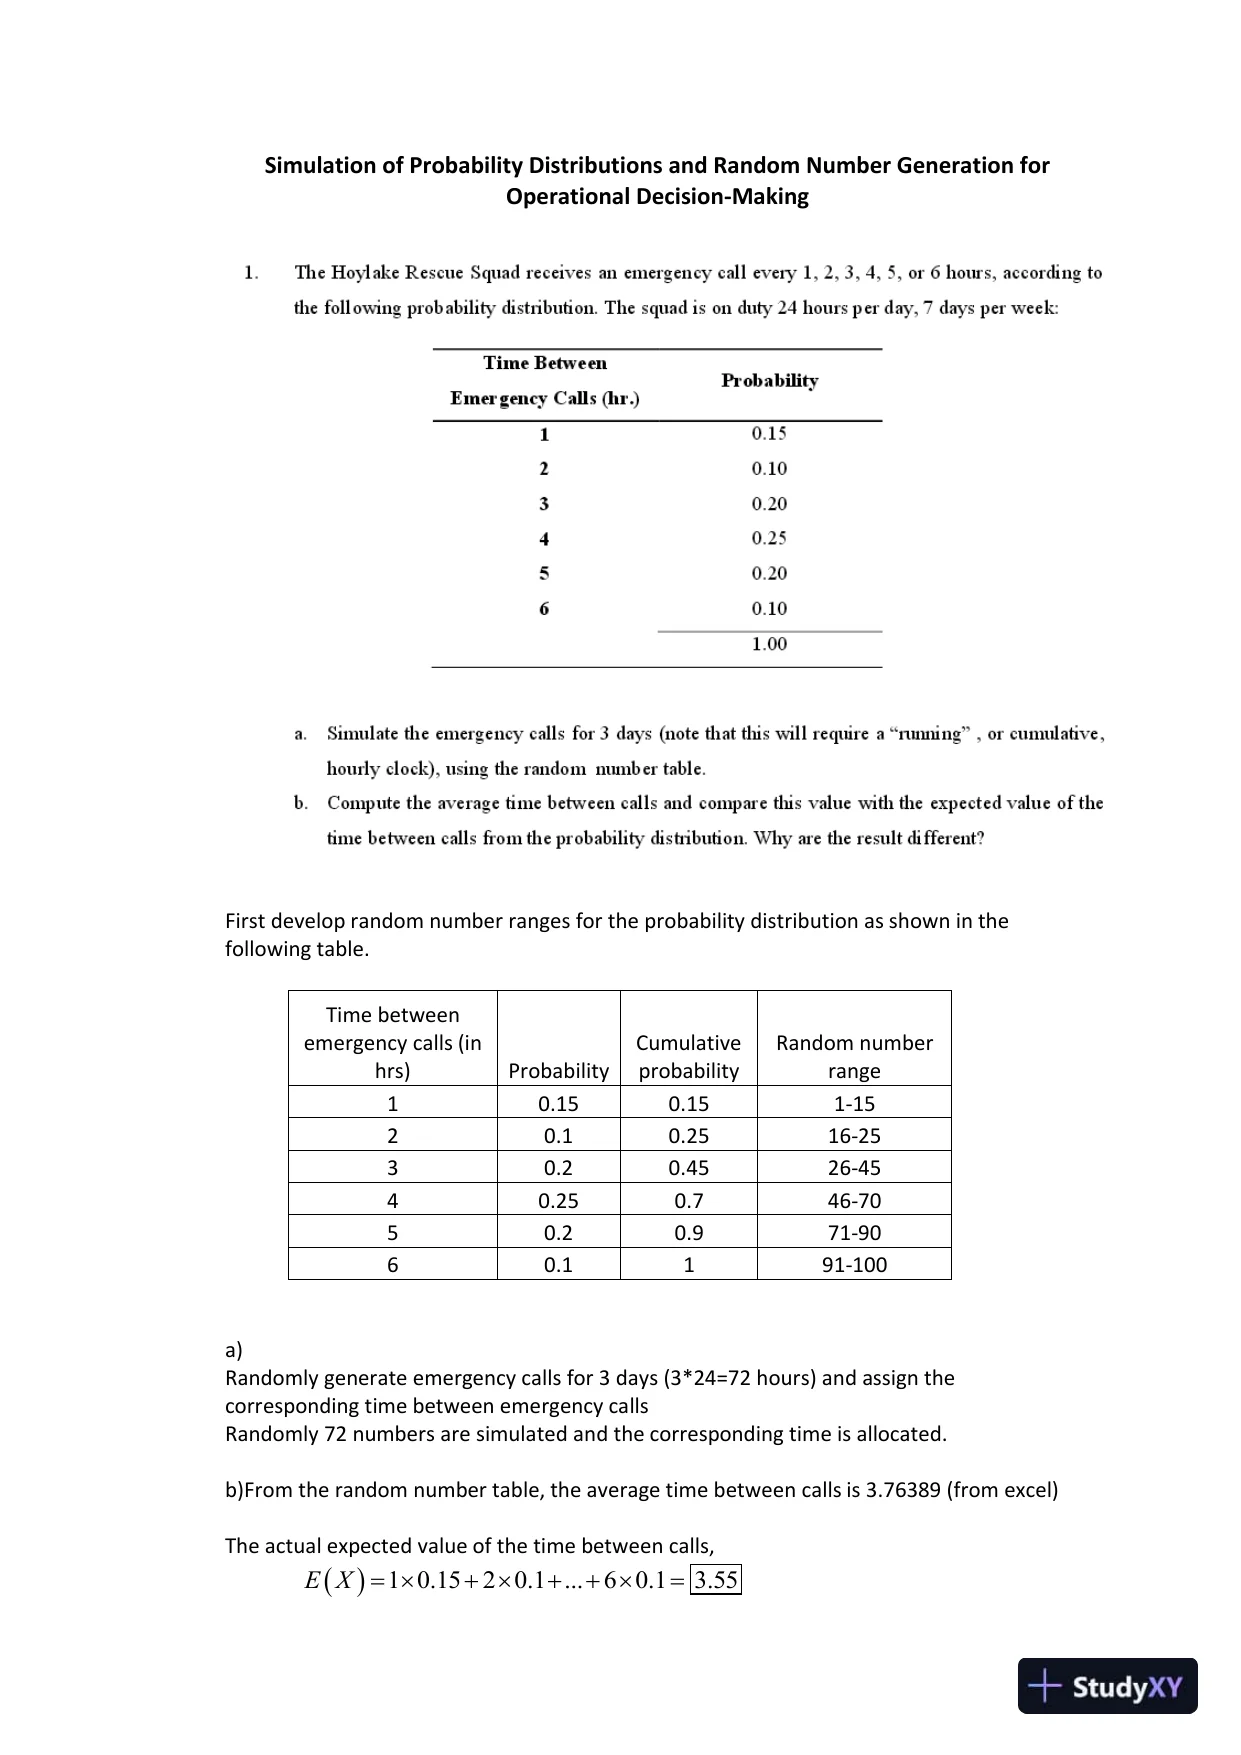
 Simulation of Probability Distributions and Random Number Generation forOperational Decision-MakingFirst develop random number ranges for the probability distribution as shown in thefollowing table.Time betweenemergency calls (inhrs)ProbabilityCumulativeprobabilityRandom numberrange10.150.151-1520.10.2516-2530.20.4526-4540.250.746-7050.20.971-9060.1191-100a)Randomly generateemergency calls for 3 days (3*24=72 hours) and assign thecorresponding time between emergency callsRandomly 72 numbers are simulated and the corresponding time is allocated.b)From the random number table, the average time between calls is 3.76389 (from excel)The actual expected value of the time between calls,10.1520.1...60.13.55EX
 Preview Mode
This document has 10 pages. Sign in to access the full document!