Solution Manual for Basic Business Statistics, 14th Edition

Solve your textbook exercises quickly and effectively with Solution Manual for Basic Business Statistics, 14th Edition, your go-to solutions manual.

Natalie Barnes
Contributor
4.5
33
10 months ago
Preview (16 of 1442 Pages)
100%
Log in to unlock

Page 1

Solution Manual for Basic Business Statistics, 14th Edition - Page 1 preview image

Loading page ...

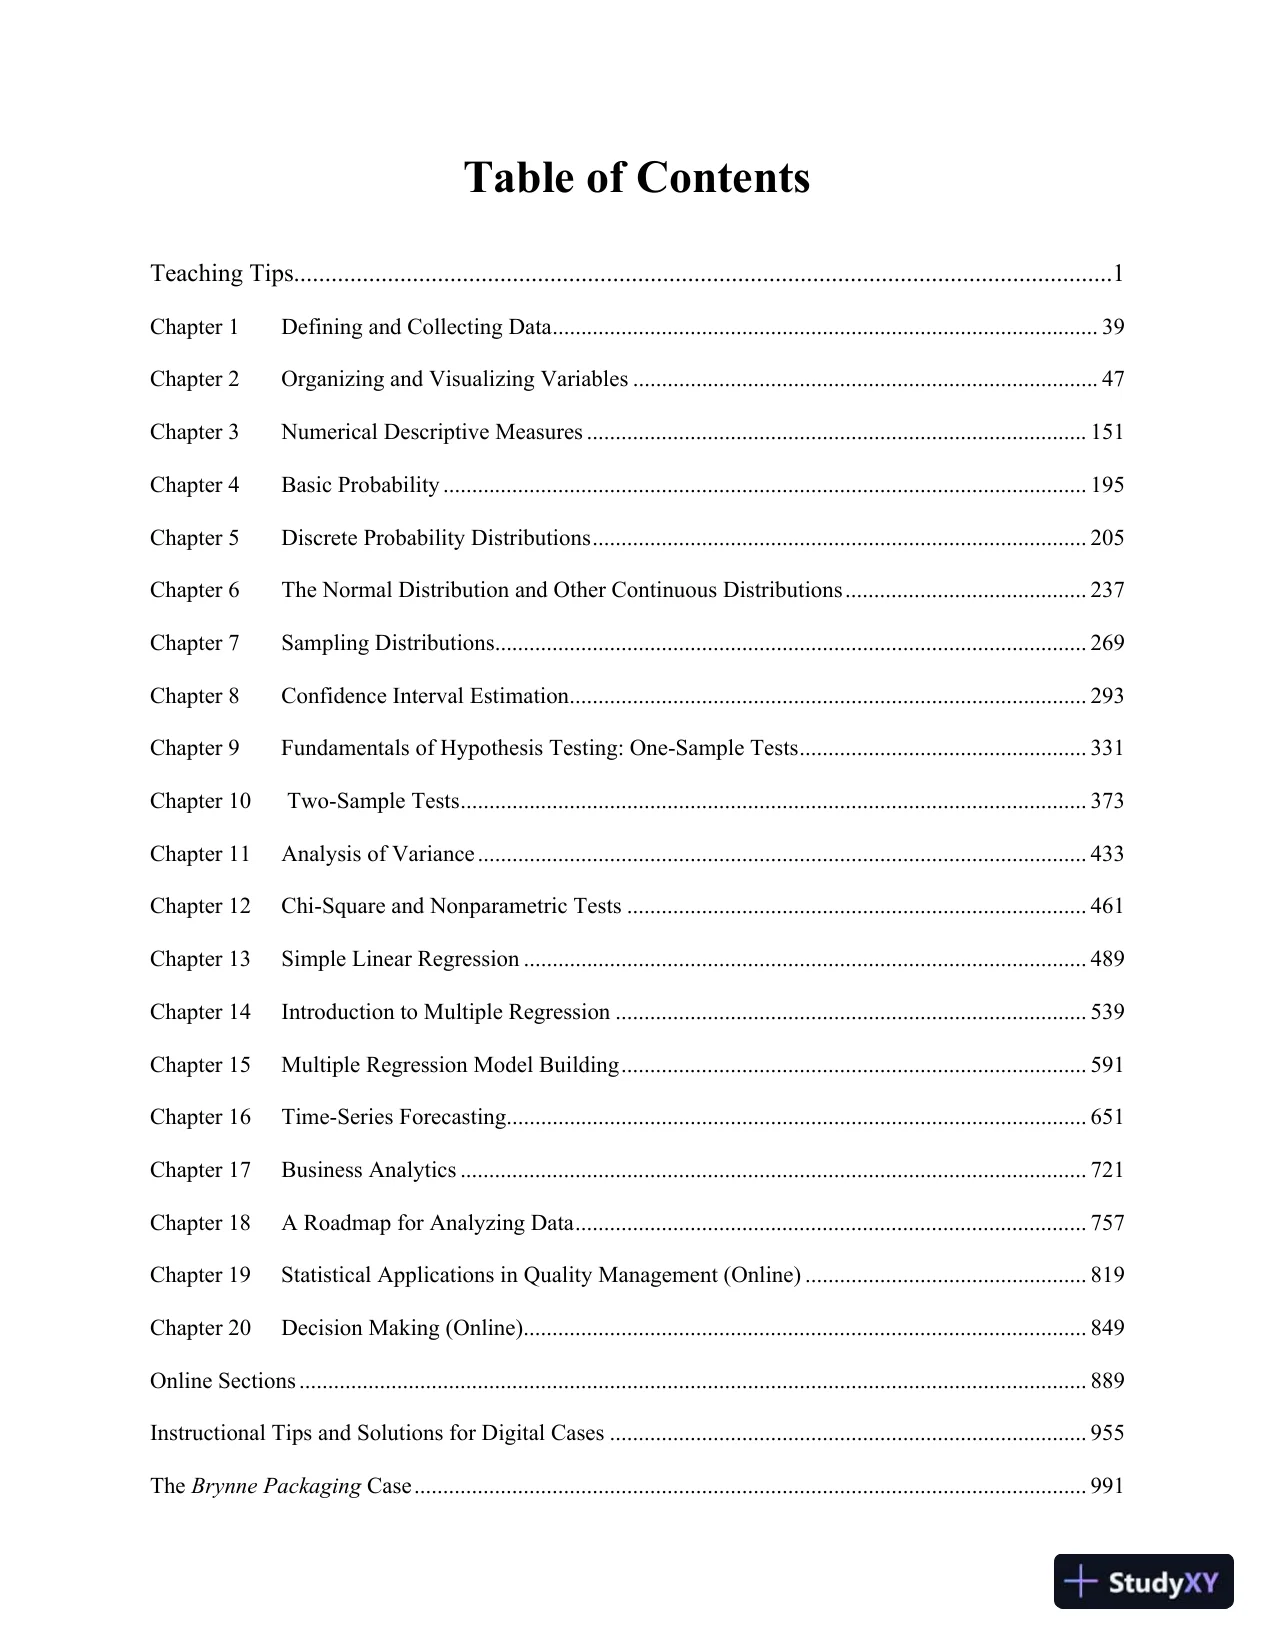
Table of ContentsTeaching Tips...................................................................................................................................1Chapter 1Defining and Collecting Data............................................................................................... 39Chapter 2Organizing and Visualizing Variables ................................................................................. 47Chapter 3Numerical Descriptive Measures ....................................................................................... 151Chapter 4Basic Probability ................................................................................................................ 195Chapter 5Discrete Probability Distributions...................................................................................... 205Chapter 6The Normal Distribution and Other Continuous Distributions .......................................... 237Chapter 7Sampling Distributions....................................................................................................... 269Chapter 8Confidence Interval Estimation.......................................................................................... 293Chapter 9Fundamentals of Hypothesis Testing: One-Sample Tests.................................................. 331Chapter 10Two-Sample Tests............................................................................................................. 373Chapter 11Analysis of Variance .......................................................................................................... 433Chapter 12Chi-Square and Nonparametric Tests ................................................................................ 461Chapter 13Simple Linear Regression .................................................................................................. 489Chapter 14Introduction to Multiple Regression .................................................................................. 539Chapter 15Multiple Regression Model Building................................................................................. 591Chapter 16Time-Series Forecasting..................................................................................................... 651Chapter 17Business Analytics ............................................................................................................. 721Chapter 18A Roadmap for Analyzing Data......................................................................................... 757Chapter 19Statistical Applications in Quality Management (Online) ................................................. 819Chapter 20Decision Making (Online).................................................................................................. 849Online Sections ......................................................................................................................................... 889Instructional Tips and Solutions for Digital Cases ................................................................................... 955TheBrynne PackagingCase ..................................................................................................................... 991

Page 2

Solution Manual for Basic Business Statistics, 14th Edition - Page 2 preview image

Loading page ...

Page 3

Solution Manual for Basic Business Statistics, 14th Edition - Page 3 preview image

Loading page ...

TheCardioGood FitnessCase.................................................................................................................. 993TheChoice Is Yours/More Descriptive Choices Follow-upCase .......................................................... 1105TheClear Mountain State Student SurveysCase.................................................................................... 1201TheCraybill Instrumentation CompanyCase ........................................................................................ 1373TheManaging Ashland MultiComm ServicesCase................................................................................ 1375TheMountain States Potato CompanyCase........................................................................................... 1423TheSure Value Convenience StoresCase .............................................................................................. 1431

Page 4

Solution Manual for Basic Business Statistics, 14th Edition - Page 4 preview image

Loading page ...

1Teaching TipsOur Starting PointOf late, business statistics has been expanding and combining with other disciplines to form new fields ofstudy such as business analytics. Because of these changes, business statistics has become an increasinglyimportant part of business education. One must consistently reflect on which business statistics topicsshould get taught and how those topics should be taught.As authors, we seek ways to continuously improve the teaching of business statistics have alwaysguided our efforts. We are members of the Decision Sciences Institute (DSI) and American StatisticalAssociation (ASA) and attend their annual conferences. We are members of the DSI Data, Analytics andStatistics Instruction (DASI) Special Interest Group and are frequent presenters at DASI sessions held atannual and regional DSI meetings. We use the ASA’s Guidelines for Assessment and Instruction(GAISE) reports and combine them with our experiences teaching business statistics to a diverse studentbody at several large universities.What to teach and how to teach it are particularly significant questions to ask during a time ofchange. As an author team, we bring a unique collection of experiences that we believe helps us find theproper perspective in balancing the old and the new. Mark Berenson and David Levine were the firsteducators to create a business statistics textbook that discussed using statistical software and that usedcomputer output as illustrations. They introduced many additional teaching and curricular innovations intheir careers, and with David Stephan developed the first comprehensive introductory business statisticstextbook that featured Microsoft Excel.Kathryn Szabat has provided statistical advice to various business and non-business communities.Her extensive background in statistics and operations research and her experiences interacting withprofessionals in practice guided her to develop and chair a new, interdisciplinary Business Systems andAnalytics department, in response to the technology- and data-driven changes occurring in businesstoday. David Stephan, an information system specialist, devised new courses and teaching methods forcomputer information systems, creating and teaching in one of the first personal computerclassroomsin alarge school of business. He became involved in early digital media efforts to improve education andlectured about the importance of data in a digital media, which led him to join Berenson’s and Levine’sefforts to improve statistics education and simplify interactions with statistical programs. Our work alsobenefits from teaching and research interests and the diversity of interests and generous contributions ofour past co-author, Timothy Krehbiel.

Page 5

Solution Manual for Basic Business Statistics, 14th Edition - Page 5 preview image

Loading page ...

2Teaching TipsFive Guiding PrinciplesWhen writing for introductory business statistics students, five principles guide us.1.Help students see the relevance of statistics to their own careers by providing examples drawnfrom the functional areas in which they may be specializing.Students need a frame of referencewhen learning statistics, especially when statistics is not their major. That frame of reference forbusiness students should be the functional areas of business, such as accounting, finance, informationsystems, management, and marketing. Each statistics topic needs to be presented in an applied contextrelated to at least one of these functional areas. The focus in teaching each topic should be on itsapplication in business, the interpretation of results, the evaluation of the assumptions, and thediscussion of what should be done if the assumptions are violated.2.Emphasize interpretation of statistical results over mathematical computation.Introductorybusiness statistics courses should recognize the growing need tointerpretstatistical results thatcomputerized processes create. This makes the interpretation of results more important than knowinghow to execute the tedious hand calculations required to produce them.3.Give students ample practice in understanding how to apply statistics to business.Bothclassroom examples and homework exercises should involve actual or realistic data as much aspossible. Students should work with data sets, both small and large, and be encouraged to lookbeyond the statistical analysis of data to the interpretation of results in a managerial context.4.Familiarize students with how to use statistical software to assist business decision-making.Introductory business statistics courses should recognize that programs with statistical functions arecommonly found on a business decision maker’s desktop computer. Integrating statistical softwareinto all aspects of an introductory statistics course enables the course to focus on interpretation ofresults instead of computations (see second point).5.Provide clear instructions to students for using statistical applications.Books should explainclearly how to use programs such as Microsoft Excel, JMP, and Minitab with the study of statistics,without having those instructions dominate the book or distract from the learning of statisticalconcepts.

Page 6

Solution Manual for Basic Business Statistics, 14th Edition - Page 6 preview image

Loading page ...

Teaching Tips3First Things First ChapterIn a time of change, you can never know exactly what knowledge and background students bring into anintroductory business statistics classroom. Add that to the need to curb the fear factor about learningstatistics that so many students begin with, and there’s a lot to cover even before you teach your firststatistical concept.We created “First Things First” to meet this challenge. This unit sets the context for explainingwhat statistics is (not what students may think!) while ensuring that all students share an understanding ofthe forces that make learning business statistics critically important today. Especially designed forinstructors teaching with course management tools, including those teaching hybrid or online courses,“First Things First” has been developed to be posted online or otherwise distributed before the first classmeets.We would argue that the most important class is the first class. First impressions are criticallyimportant. You have the opportunity to set the tone to create a new impression that the course will beimportant to the business education of your students. Make the following points:This course is not a math course.State that you will be learning analytical skills for making business decisions.Explain that the focus will be on how statistics can be used in the functional areas of business.This book uses a systematic approach for meeting a business objective or solving a business problem.This approach goes across all the topics in the book and most importantly can be used as a framework inreal world situations when students graduate. The approach has the acronymDCOVA, which stands forDefine,Collect,Organize,Visualize, andAnalyze.Define the business objective or problem to be solved and then define the variables to be studied.Collect the data from appropriate sourcesOrganize the dataVisualize the data by developing chartsAnalyze the data by using statistical methods to reach conclusions.You can begin by emphasizing the importance of defining your objective or problem. Then, discuss theimportance of operational definitions of variables to be considered and define variable, data, andstatistics.Just as computers are used not just in the computer course, students need to know that statistics isused not just in the statistics course. This leads you to a discussion of business analytics in which data isused to make decisions. Make the point that analytics should be part of the competitive strategy of every

Page 7

Solution Manual for Basic Business Statistics, 14th Edition - Page 7 preview image

Loading page ...

4Teaching Tipsorganization especially when “big data”, meaning data collected in huge volumes at very fast rates, needsto be analyzed.1.Inform the students that there is an Excel Guide, a JMP Guide, and a Minitab Guide at the end ofeach chapter.2.Strongly encourage or require students to read the guide for the software they will be using aspreparation for using that software with this book.

Page 8

Solution Manual for Basic Business Statistics, 14th Edition - Page 8 preview image

Loading page ...

Teaching Tips5Chapter 1You need to continue the discussion of the Define task by establishing the types of variables. Mention theimportance of having an operational definition for each variable. Be sure to discuss the different typescarefully because the ability to distinguish between categorical and numerical data will be crucial later inthe course. Go over examples of each type of variable and have students provide examples of each type.Then, if you wish, you can cover the different measurement scales.Then move on to the C of the DCOVA approach, collecting data. Mention the different sources ofdata and make sure to cover the fact that data often needs to be cleaned of errors. Then, you could spendsome time discussing sampling, even if it is just using the table of random numbers to select a randomsample. You may want to take a bit more time and discuss the types of survey sampling methods andissues involved with survey sampling results. TheThink About Thisessay discusses the important issue ofthe use of Web-based surveys.There is also a section on Data Cleaning that discusses the issues that occur in data collection.This is followed by a section on data formatting that includes the important concepts of stacking andunstacking variables and recoding variables. The last section discusses the types of errors that occur insurveys.The chapter also introduces three continuing cases related to theManaging Ashland MultiCommServices,CardioGood Fitness, andClear Mountain State Student Surveysthat appear at the end of manychapters. The Digital Cases are introduced in this chapter also. In these cases, students visit Web sitesrelated to companies and issues raised in the Using Statistics scenarios that start each chapter. The goal ofthe Digital Cases is for students to develop skills needed to identify misuses of statistical information. Aswould be the situation with many real-world cases, in Digital Cases, students often need to sift throughclaims and assorted information in order to discover the data most relevant to a case task. They will thenhave to examine whether the conclusions and claims are supported by the data. (Instructional tips forusing theManaging Ashland MultiComm Services,and Digital Cases and solutions to theManagingAshland MultiComm Service,CardioGood Fitness, Clear Mountain State Student Surveys, and DigitalCases are included in thisInstructor’s Solutions Manual.).Make sure that students read the Excel Guide and/or JMP Guide or Minitab Guide at the end ofeach chapter. TheWorkbookExcel instructions provide step-by-step instructions and live worksheets thatautomatically update when data changes. ThePHStatExcelinstructions provide instructions for using thePHStat add-in with Excel. TheAnalysis ToolPakinstructions provide instructions for using the AnalysisToolPak, the Excel statistical add-in that is included with Microsoft Excel.

Page 9

Solution Manual for Basic Business Statistics, 14th Edition - Page 9 preview image

Loading page ...

6Teaching TipsChapter 2This chapter moves on to the organizing and visualizing steps of the DCOVA framework. If you aregoing to collect sample data to use in Chapters 2 and 3, you can illustrate sampling by conducting asurvey of students in your class. Ask each student to collect his or her own personal data concerning thetime it takes to get ready to go to class in the morning or the time it takes to get to school or home fromschool. First, ask the students to write down a definition of how they plan to measure this time. Then,collect the various answers and read them to the class. Then, a single definition could be provided (suchas the time to get ready is the time measured from when you get out of bed to when you leave your home,recorded to the nearest minute). In the next class, select a random sample of students and use the datacollected (depending on the sample size) in class when Chapters 2 and 3 are discussed. Then, move on tothe Organize step that involves setting up your data in an Excel, JMP, or Minitab. Show the summaryworksheet and develop tables to help you prepare charts and analyze your data. Begin your discussion forcategorical data with the example on p. 43 concerning the percentage of the time millennials use differentdevices for watching televisionand then if you wish, explain that you can sometimes organize the datainto a two-way table that has one variable in the row and another in the column.Continue with organizing data (but now for numerical data) by referring to the cost of a restaurantmeal on p. 46. Show the simple ordered array and how a frequency distribution, percentage distribution,or cumulative distribution can summarize the raw data in a way that is more useful.Now you are ready to tackle the Visualize step. A good way of starting this part of the chapter is todisplay the following quote."A picture is worth a thousand words."Students will almost certainly be familiar with Microsoft®Word and may have already used Excel toconstruct charts that they have pasted into Word documents. Now you will be using Excel or JMP orMinitab to construct many different types of charts. Return to the data previously discussed on whatdevices millennials use to watch television and illustrate how a bar chart and pie chart can be constructed.Mention their advantages and disadvantages. A good example is to show the data on incomplete ATMtransactions on p. 75 and how the Pareto chart enables you to focus on the vital few categories. If timepermits, you can discuss the side-by-side bar chart for a contingency table.To examine charts for numerical variables you can either use the restaurant data previouslymentioned or data that you have collected from your class. You may want to begin with a simple stem-and-leaf display that both organizes the data and shows a bar type chart. Then move on to the histogramand the various polygons, pointing out the advantages and disadvantages of each.

Page 10

Solution Manual for Basic Business Statistics, 14th Edition - Page 10 preview image

Loading page ...

Teaching Tips7If time permits, you can discuss the scatter plot and the time-series plot for two numericalvariables. Otherwise, you can wait until you get to regression analysis. Also, you may want to discusshow multidimensional tables allow you to see several variables simultaneously.If the opportunity is available, we believe that it is worth the time to cover Section 2.9 on Pitfalls inOrganizing and Visualizing Data. This is a topic that students very much enjoy because it allows for agreat deal of classroom interaction. After discussing the fundamental principles of good graphs, try toillustrate the improper display shown in Figure 2.31. Ask students what is “bad” about this figure. Followup with a homework assignment involving Problems 2.69 – 2.73 (USA Todayis a great source).You will find that the chapter review problems provide large data sets with numerous variables. Reportwriting exercises provide the opportunity for students to integrate written and/or oral presentation with thestatistics they have learned.TheManaging Ashland MultiComm Servicescase enables students to examine the use ofstatistics in an actual business environment. The Digital Case refers to the EndRun Financial Services andclaims that have been made. The CardioGood Fitness case focuses on developing a customer profile for amarket research team. The ChoiceIsYours Follow-up expands on the chapter discussion of the mutualfunds data. The Clear Mountain State Student Survey provides data collected from a sample ofundergraduate students and a separate sample of graduate students.The Excel, JMP, and Minitab Guides for this and the remaining chapters are organized accordingto the sections of the chapter. They are quite extensive because they cover both organizing and visualizingmany different graphs. The Excel Guide includes instructions for Workbook, PHStat, and the AnalysisToolPak. Picking and choosing among these choices enables you to choose a preferred approach.

Page 11

Solution Manual for Basic Business Statistics, 14th Edition - Page 11 preview image

Loading page ...

8Teaching TipsChapter 3This chapter on descriptive numerical statistical measures represents the initial presentation of statisticalsymbols in the text. Students who need to review arithmetic and algebraic concepts can read Appendix Afor a quick review or use appropriate texts online streaming videos or pay for study aids from third-partiessuchwww.videoaidedinstruction.com(for which one of the authors serves as a video instructor). Onceagain, as with the tables and charts constructed for numerical data, it is useful to provide an interesting setof data for classroom discussion. If a sample of students was selected earlier in the semester and dataconcerning student time to get ready or commuting time were collected (see Chapters 1 and 2), use thesedata in developing the numerous descriptive summary measures in this chapter. (If they have not beendeveloped, use other data for classroom illustration.)Discussion of the chapter begins with the property of central tendency. We have found thatalmost all students are familiar with the arithmetic mean (which they know as the average) and moststudents are familiar with the median. A good way to begin is to compute the mean for your classroomexample. Emphasize the effect of extreme values on the arithmetic mean and point out that the mean islike the center of a seesaw -- a balance point. Note that you will return to this concept later when youdiscuss the variance and the standard deviation. You might want to introduce summation notation at thispoint and express the arithmetic mean in formula notation as in Equation (3.1). (Alternatively, you couldwait until you cover the variance and standard deviation.) A classroom example in which summationnotation is reviewed is usually worthwhile. Remind the students again that Appendix A includes a reviewof arithmetic and algebra and summation notation and refer them to other sources, if necessaryThe next statistic to compute is the median. Be sure to remind the students that the median as ameasure of position must have all the values ranked in order from lowest to highest. Be sure to have thestudents compare the arithmetic mean to the median and explain that this tells us something about anotherproperty of data (skewness). Following the median, the mode can be briefly discussed. Once again, havethe students compare this result to those of the arithmetic mean and median for your data set. If timepermits, you can also discuss the geometric mean which is heavily used in finance.The completion of the discussion of central tendency leads to the second characteristic of data,variability. Mention that all measures of variation have several things in common: (1) they can never benegative, (2) they will be equal to 0 when all items are the same, (3) they will be small when there isn'tmuch variation, and (4) they will be large when there is a great deal of variation.The first measure of variability to consider is the simplest one, the range. Be sure to point out thatthe range only provides information about the extremes, not about the distribution between the extremes.Point out that the range lacks one important ingredient, the ability to take into account each data value.Bring up the idea of computing the differences around the mean, but then return to the fact that as the

Page 12

Solution Manual for Basic Business Statistics, 14th Edition - Page 12 preview image

Loading page ...

Teaching Tips9balance point of the seesaw, these differences add up to zero. At that point, ask the students what they cando mathematically to remove the negative sign for some of the values. Most likely, they will answer bytelling you to square them (although someone may realize that the absolute value could be taken). Next,you may want to define the squared differences as a sum of squares. Now you need to have the studentsrealize that the number of values being considered affects the magnitude of the sum of squareddifferences. Therefore, it makes sense to divide by the number of values and compute a measure calledthe variance. If a population is involved, you divide byN, the population size, but if you are using asample, you divide byn- 1, to make the sample result a better estimate of the population variance. Youcan finish the development of variation by noting that because the variance is in squared units, you needto take the square root to compute the standard deviation.Another measure of variation that can be discussed is the coefficient of variation. Be sure toillustrate the usefulness of this as a measure of relative variation by using an example in which two datasets have vastly different standard deviations, but also vastly different means. A good example is one thatinvolves the volatility of stock prices. Point out that the variation of the price should be considered in thecontext of the magnitude of the arithmetic mean. By changing values in the data provided, students canobserve how the mean, median, and standard deviation are affected.The final measure of variation is theZscore. Point out that this provides a measure of variation instandard deviation units. You can also say that you will return toZscores in Chapter 6 when the normaldistribution will be discussed.You are now ready to move on to the third characteristic of data, shape. Be sure to clearly defineand illustrate both symmetric and skewed distributions by comparing the mean and median. You may alsowant to briefly mention the property of kurtosis which is the relative concentration of values in the centerof the distribution as compared to the tails. This statistic is provided by Excel through an Excel functionor the Analysis Toolpak and by JMP or Minitab. Once these three characteristics have been discussed,you are ready to show how they can be computed using Excel, JMP, or Minitab.Now that these measures are understood, you can further explore data by computing the quartiles,the interquartile range, the five number summary, and constructing a boxplot. You begin by determiningthe quartiles. Reference here can be made to the standardized exams that most students have taken, andthe quantile scores that they have received (97th percentile, 48th percentile, 12th percentile, …, etc.).Explain that the 1stand 3rdquartiles are merely two special quantiles -- the 25th and 75th, that unlike themedian (the 2ndquartile), are not at the center of the distribution.Once the quartiles have beencomputed, the interquartile range can be determined. Mention that the interquartile range computes thevariation in the center of the distribution as compared to the difference in the extremes computed by therange.

Page 13

Solution Manual for Basic Business Statistics, 14th Edition - Page 13 preview image

Loading page ...

10Teaching TipsYou can then discuss the five-number summary of minimum value, first quartile, median, thirdquartile, and maximum value. Then, you construct the boxplot. Present this plot from the perspective ofserving as a tool for determining the location, variability, and symmetry of a distribution by visualinspection, and as a graphical tool for comparing the distribution of several groups. It is useful to displayFigure 3.9 on page 142 that indicates the shape of the boxplot for four different distributions. Then, usePHStat or JMP or Minitab to construct a boxplot. Note that you can construct the boxplot for a singlegroup or for multiple groups.If you desire, you can discuss descriptive measures for a population and introduce the empirical rule andthe Chebyshev rule.If time permits, and you have covered scatter plots in Chapter 2, you can briefly discuss thecovariance and the coefficient of correlation as a measure of the strength of the association between twonumerical variables. Point out that the coefficient of correlation has the advantage as compared to thecovariance of being on a scale that goes from -1 to +1. Figure 3.12 on p. 150 is useful in depicting scatterplots for different coefficients of correlation.Once again, you will find that the chapter review problems provide large data sets with numerousvariables.TheManaging Ashland MultiComm Servicescase enables students to examine the use ofdescriptive statistics in an actual business environment. The Digital Case continues the evaluation of theEndRun Financial Services discussed in the Digital Case in Chapter 2. The CardioGood Fitness casefocuses on developing a customer profile for a market research team. More Descriptive Choices Follow-up expands on the discussion of the mutual funds data. The Clear Mountain State Student Surveyprovides data collected from a sample of undergraduate students and a separate sample of graduatestudents.The Excel Guide for the chapter includes instructions on using different Excel functions tocompute various statistics. Alternatively, you can use PHStat or the Analysis ToolPak to compute a list ofstatistics. PHStat can be used to construct a boxplot. Or you can use JMP or Minitab.

Page 14

Solution Manual for Basic Business Statistics, 14th Edition - Page 14 preview image

Loading page ...

Teaching Tips11Chapter 4The chapter on probability represents a bridge between the descriptive statistics already covered and thetopics of statistical inference, regression, time series, and quality improvement to be covered insubsequent chapters. In many traditional statistics courses, often a great deal of time is spent onprobability topics that are of little direct applicability in basic statistics. The approach in this text is tocover only those topics that are of direct applicability in the remainder of the text.You need to begin with a relatively concise discussion of some probability rules. Essentially,students really just need to know that (1) no probability can be negative, (2) no probability can be morethan 1, and (3) the sum of the probabilities of a set of mutually exclusive events adds to 1.0. Studentsoften understand the subject best if it is taught intuitively with a minimum of formulas, with an examplethat relates to a business application shown as a two-way contingency table (see the Using Statisticsexample). If desired, you can use Workbook Excel or PHStat to compute probabilities from thecontingency table.Once these basic elements of probability have been discussed, if there is time and you desire,conditional probability and Bayes’ theorem can be covered. TheThink About Thisconcerning emailSPAM is a wonderful way of helping students realize the application of probability to everyday life. Inaddition, you may wish to spend a bit of time going over counting rules, especially if the binomialdistribution will be covered in Chapter 5.Be aware that in a one-semester course where time is particularly limited, these topics may be ofmarginal importance. The Digital Case in this chapter extends the evaluation of the EndRun FinancialServices to consider claims made about various probabilities. The CardioGood Fitness, More DescriptiveChoices Follow-up, and Clear Mountain State Student Survey each involve developing contingency tablesto be able to compute and interpret conditional and marginal probabilities.

Page 15

Solution Manual for Basic Business Statistics, 14th Edition - Page 15 preview image

Loading page ...

12Teaching TipsChapter 5Now that the basic principles of probability have been discussed, the probability distribution is developedand the expected value and variance (and standard deviation) are computed and interpreted. Given that aprobability distribution has been defined, you can now discuss some specific distributions. Althoughevery introductory course undoubtedly covers the normal distribution to be discussed in Chapter 6, thedecision about whether to cover the binomial or Poisson distributions is matter of personal choice anddepends on whether the course is part of a two-course sequence.If the binomial distribution is covered, an interesting way of developing the binomial formula isto follow the Using Statistics example that involves an accounting information system. Note, in thisexample, the value forpis 0.10. (It is best not to use an example withp= 0.50 because this represents aspecial case). The discussion proceeds by asking how you could get three tagged order forms in a sampleof 4. Usually a response will be elicited that provides three items of interest out of four selections in aparticular order such as Tagged Tagged Not Tagged Tagged. Ask the class, what would be the probabilityof getting Tagged on the first selection? When someone responds 0.1, ask them how they found thatanswer and what would be the probability of getting Tagged on the second selection. When they answer0.1 again, you will be able to make the point that in saying 0.1 again, they are assuming that theprobability of Tagged stays constant from trial to trial. When you get to the third selection and thestudents respond 0.9, point out that this is a second assumption of the binomial distribution -- that onlytwo outcomes are possible -- in this case Tagged and Not Tagged, and the sum of the probabilities ofTagged and Not Tagged must add to 1.0. Now you can compute the probability of three out of four in thisorder by multiplying (0.1)(0.1)(0.9)(0.1) to get 0.0036. Ask the class if this is the answer to the originalquestion. Point out that this is just one way of getting three Tagged out of four selections in a specificorder, and, that there are four ways to get three Tagged out of four selections This leads to thedevelopment of the binomial formula Equation (5.4). You might want to do another example at this pointthat calls for adding several probabilities such as three or more Tagged, less than three Tagged, etc.Complete the discussion of the binomial distribution with the computation of the mean and standarddeviation of the distribution. Be sure to point out that for samples greater than five, computations canbecome unwieldy and the student should use PHStat, an Excel function, the binomial tables (see theonlineBinomial.pdftables), JMP, or Minitab.Once the binomial distribution has been covered, if time permits, other discrete probabilitydistributions can be presented. If you cover the Poisson distribution, point out the distinction between thebinomial and Poisson distributions. Note that the Poisson is based on an area of opportunity in which youare counting occurrences within an area such as time or space. Contrast this with the binomial distributionin which each value is classified as of interest or not of interest. Point out the equations for the mean and

Page 16

Solution Manual for Basic Business Statistics, 14th Edition - Page 16 preview image

Loading page ...

Teaching Tips13standard deviation of the Poisson distribution and indicate that the mean is equal to the variance. Becausethe computation of probabilities from these discrete probability distributions can become tedious for otherthan small sample sizes, it is important to discuss PHStat, an Excel function the Poisson tables (see theonlinePoisson.pdftables) or JMP or Minitab.The covariance of a probability distribution is included as an online section. The hypergeometricdistribution is also included as an online section.TheManaging Ashland MultiComm Servicescase for this chapter relates to the binomialdistribution. The Digital Case involves the expected value and standard deviation of a probabilitydistribution and applications of the covariance in finance.
Preview Mode

This document has 1442 pages. Sign in to access the full document!