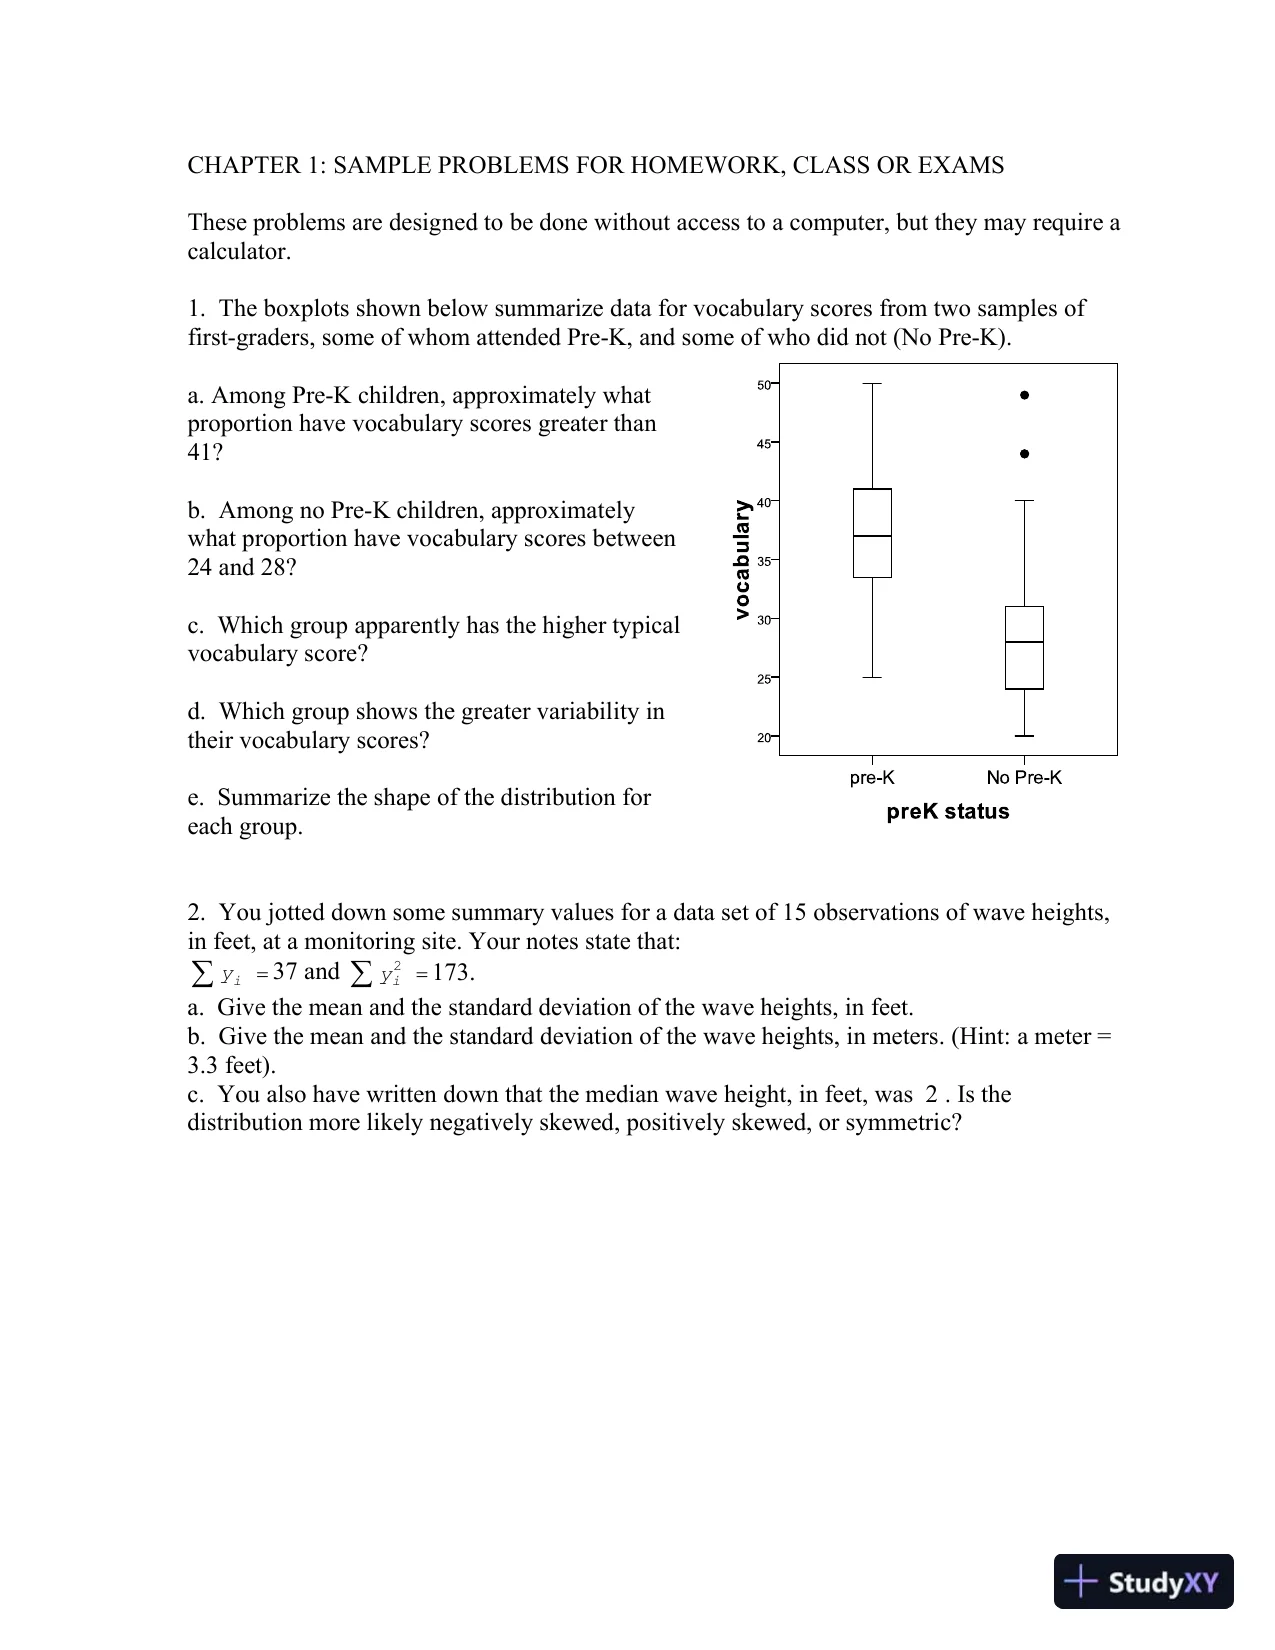
 CHAPTER 1: SAMPLE PROBLEMS FOR HOMEWORK, CLASS OR EXAMSThese problems are designed to be done without access to a computer, but they may require acalculator.1. The boxplots shown below summarize data for vocabulary scores from two samples offirst-graders, some of whom attended Pre-K, and some of who did not (No Pre-K).a. Among Pre-K children, approximately whatproportion have vocabulary scores greater than41?b. Among no Pre-K children, approximatelywhat proportion have vocabulary scores between24 and 28?c. Which group apparently has the higher typicalvocabulary score?d. Which group shows the greater variability intheir vocabulary scores?e. Summarize the shape of the distribution foreach group.2. You jotted down some summary values for a data set of 15 observations of wave heights,in feet, at a monitoring site. Your notes state that:iy37 and2iy173.a. Give the mean and the standard deviation of the wave heights, in feet.b. Give the mean and the standard deviation of the wave heights, in meters. (Hint: a meter =3.3 feet).c. You also have written down that the median wave height, in feet, was 2 . Is thedistribution more likely negatively skewed, positively skewed, or symmetric?
Preview Mode
This document has 215 pages. Sign in to access the full document!