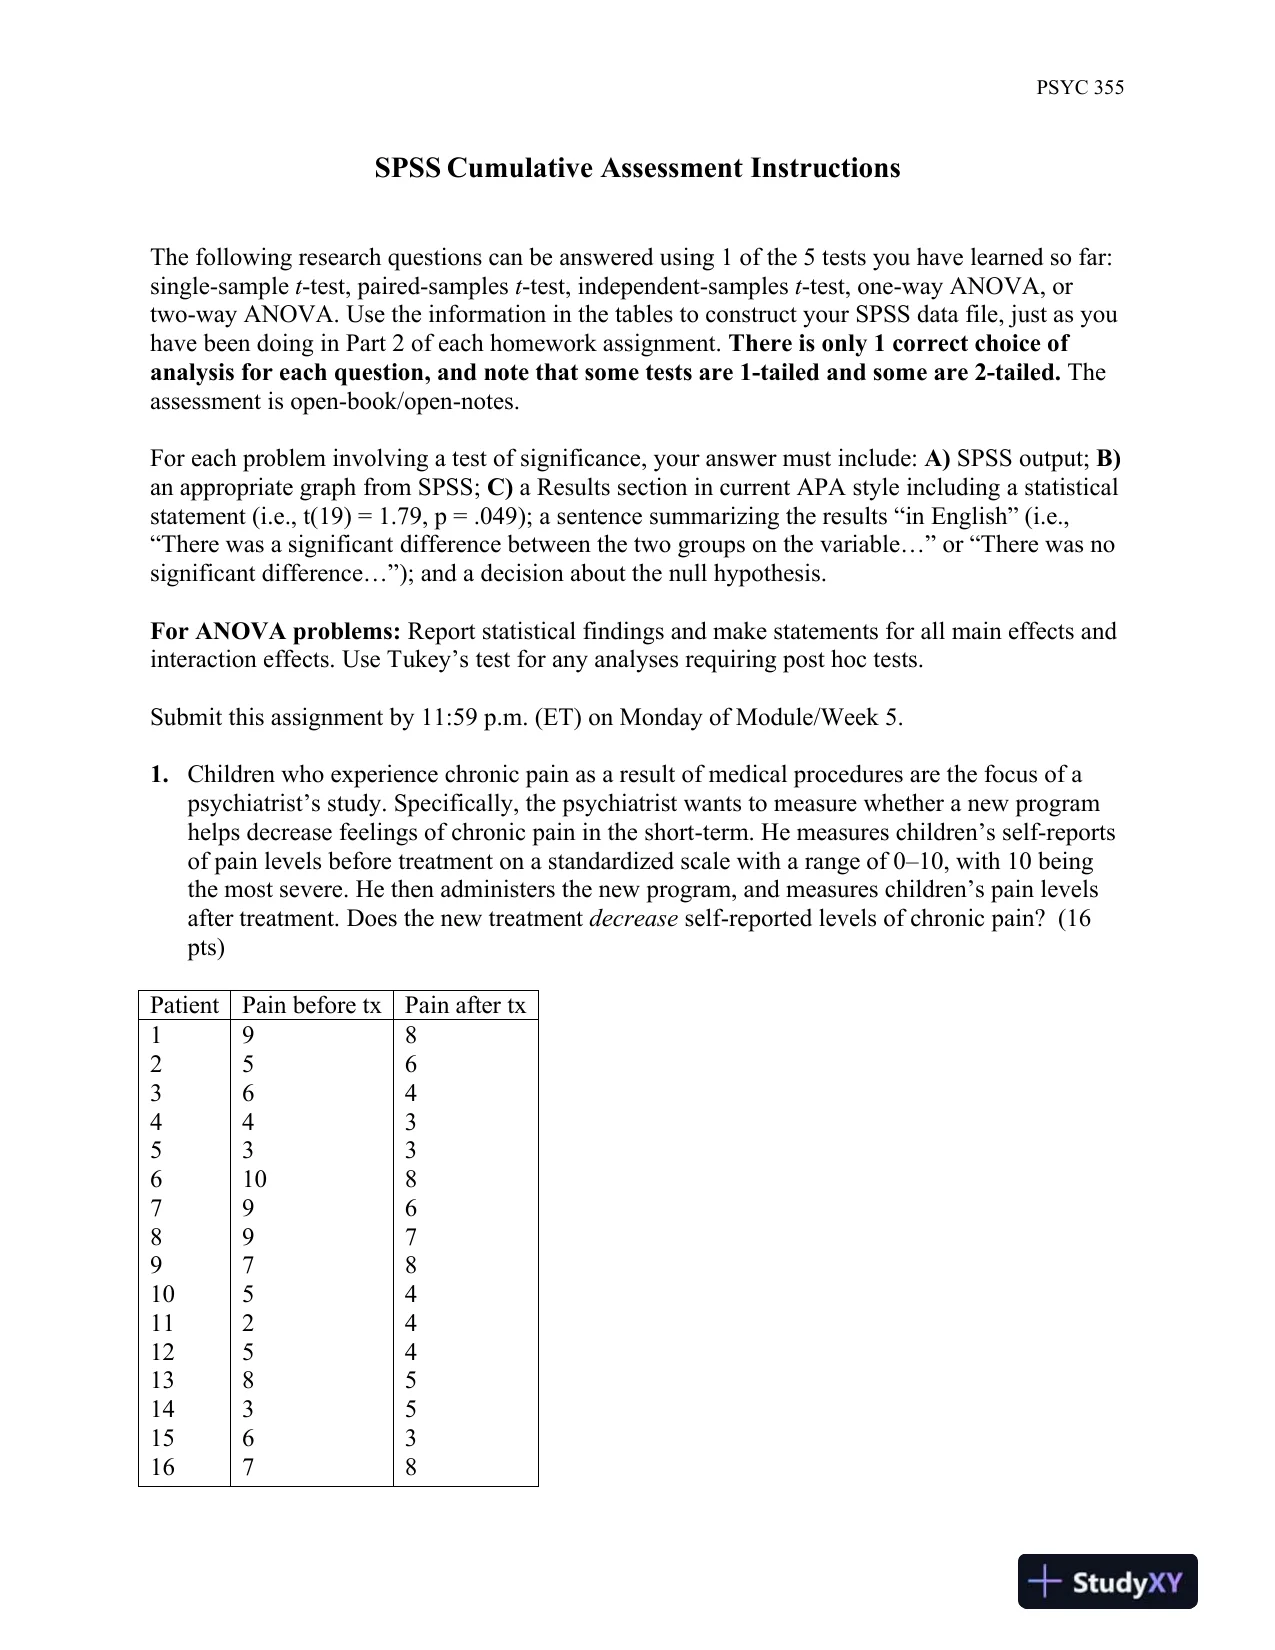
 PSYC 355Page1of13SPSSCumulative Assessment InstructionsThe following research questions can be answered using1of the5tests you have learned so far:single-samplet-test, paired-samplest-test, independent-samplest-test, one-way ANOVA, ortwo-way ANOVA.Use the information in the tables to construct your SPSS data file, just as youhave been doing in Part2of each homework assignment.There is only1correct choice ofanalysis for each question, and note that some tests are 1-tailed and some are 2-tailed.Theassessment is open-book/open-notes.For each problem involving a test of significance, your answermustinclude:A)SPSSoutput;B)an appropriate graphfrom SPSS;C)a Results section in current APA style includinga statisticalstatement(i.e.,t(19) = 1.79, p = .049);a sentence summarizing the results“in English”(i.e.,“There was a significant difference between the two groups on the variable…” or “There was nosignificant difference…”); and a decision about the null hypothesis.For ANOVAproblems:Reportstatisticalfindings and makestatementsfor all main effects andinteraction effects.Use Tukey’stestfor any analyses requiring post hoc tests.Submit this assignment by 11:59 p.m. (ET) on Monday of Module/Week 5.1.Children who experience chronic pain as a result of medical procedures are the focus of apsychiatrist’s study. Specifically, the psychiatrist wants to measure whether a new programhelps decrease feelings of chronic pain in the short-term. He measures children’s self-reportsof pain levels before treatment on astandardizedscalewith a rangeof 0–10, with 10 beingthe most severe. He then administers the new program, and measures children’s pain levelsafter treatment. Does the new treatmentdecreaseself-reported levels of chronic pain?(16pts)PatientPainbeforetxPainaftertx12345678910111213141516956431099752583678643386784445538
Preview Mode
This document has 13 pages. Sign in to access the full document!