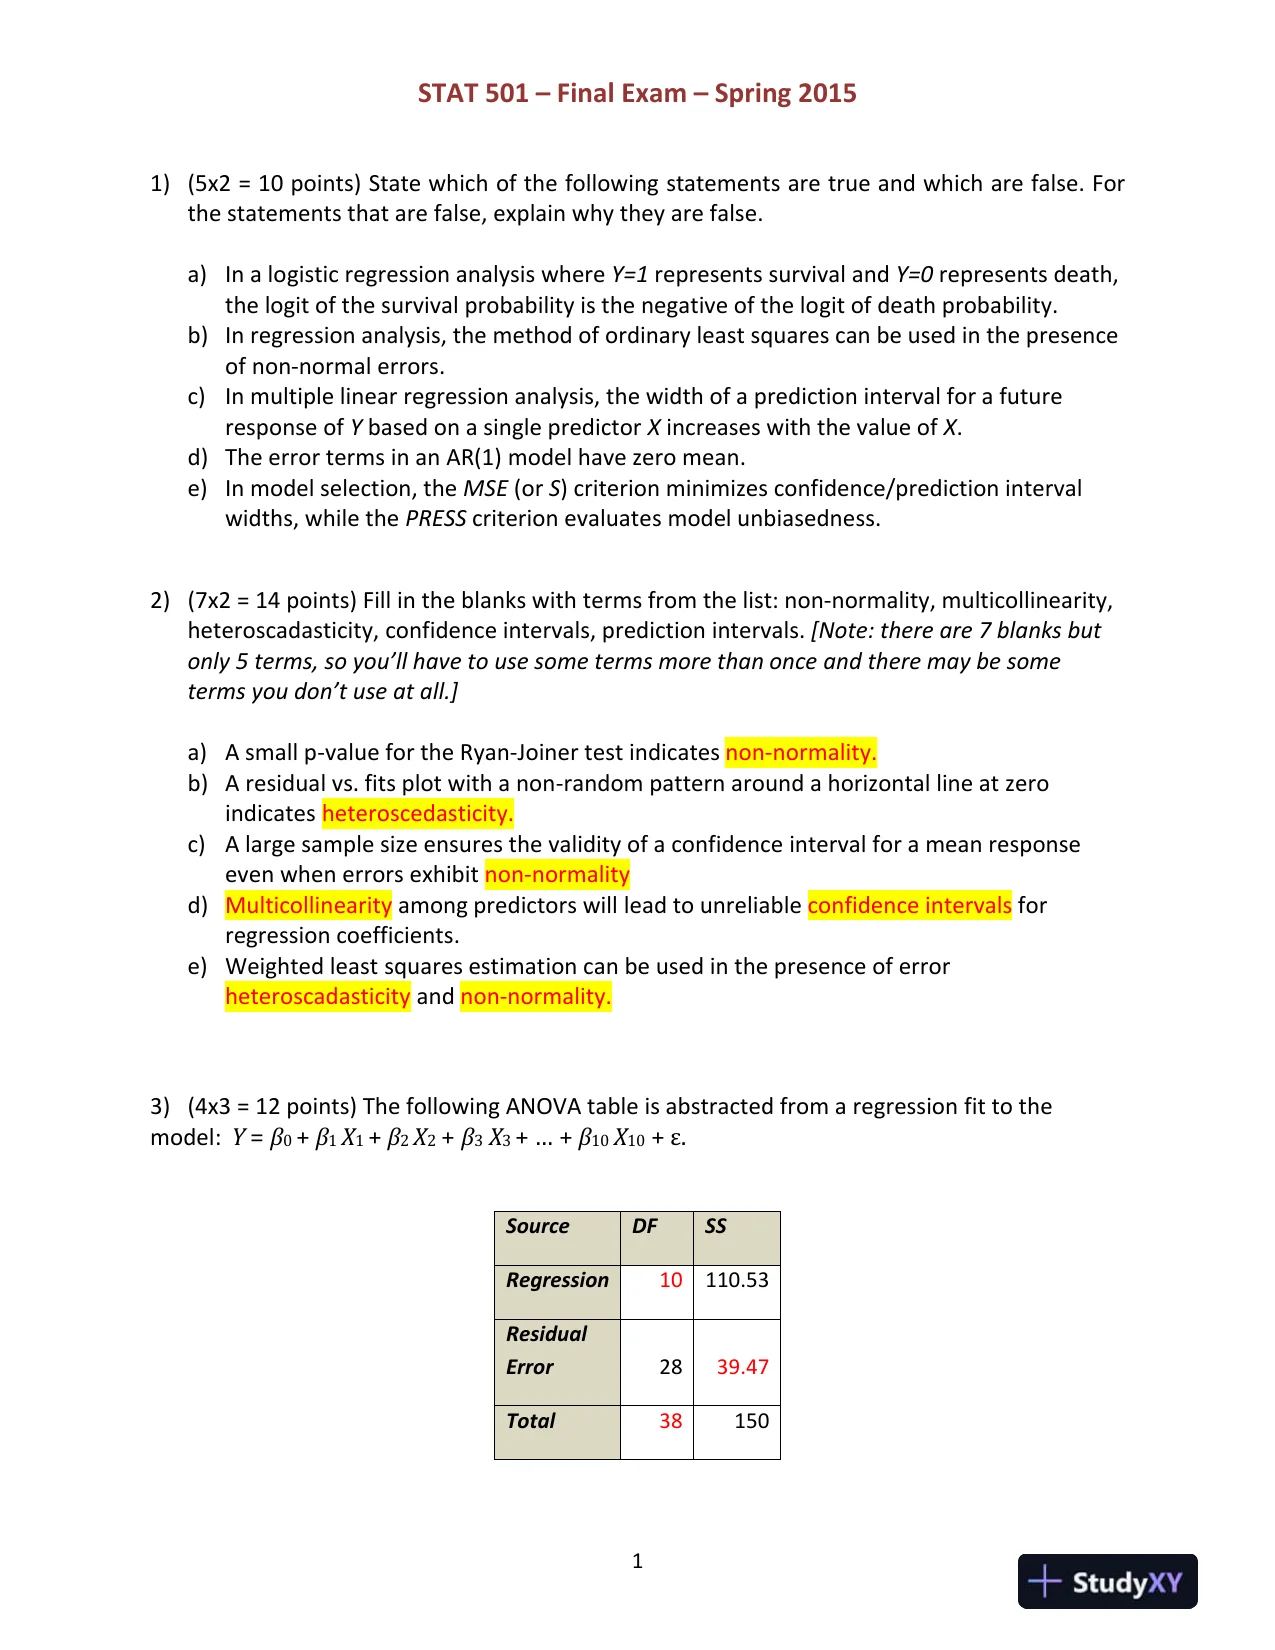
 1STAT501–Final Exam–Spring 20151)(5x2 =10points)State which of the following statements are true and which are false. Forthe statements that are false,explain why they are false.a)In a logistic regression analysis whereY=1represents survival andY=0represents death,the logit of the survival probability is the negative of the logit of death probability.b)In regression analysis, the method ofordinaryleast squares can be used in the presenceof non-normal errors.c)In multiple linear regression analysis, thewidth of aprediction intervalfora futureresponse ofYbased on a single predictorXincreaseswiththe value ofX.d)The error terms in anAR(1) modelhavezero mean.e)In model selection, theMSE(orS) criterion minimizes confidence/prediction intervalwidths, while thePRESScriterion evaluates model unbiasedness.2)(7x2 =14 points)Fill in the blanks withtermsfrom the list:non-normality, multicollinearity,heteroscadasticity,confidenceintervals, predictionintervals.[Note: there are 7 blanks butonly 5terms, so you’ll have to use some terms more than onceand there may be someterms you don’t use at all.]a)A small p-valueforthe Ryan-Joiner test indicatesnon-normality.b)A residual vs.fits plot with a non-random pattern aroundahorizontal lineatzeroindicatesheteroscedasticity.c)A large sample size ensures the validity of a confidence intervalfora mean responseeven when errorsexhibitnon-normalityd)Multicollinearityamong predictors will lead tounreliableconfidence intervalsforregression coefficients.e)Weighted least squares estimation can be used in the presence of errorheteroscadasticityandnon-normality.3)(4x3= 12points)The following ANOVA table is abstracted from a regressionfit tothemodel:Y=β0+β1X1+β2X2+β3X3+ … +β10X10+ε.SourceDFSSRegression10110.53ResidualError2839.47Total38150
Preview Mode
This document has 7 pages. Sign in to access the full document!