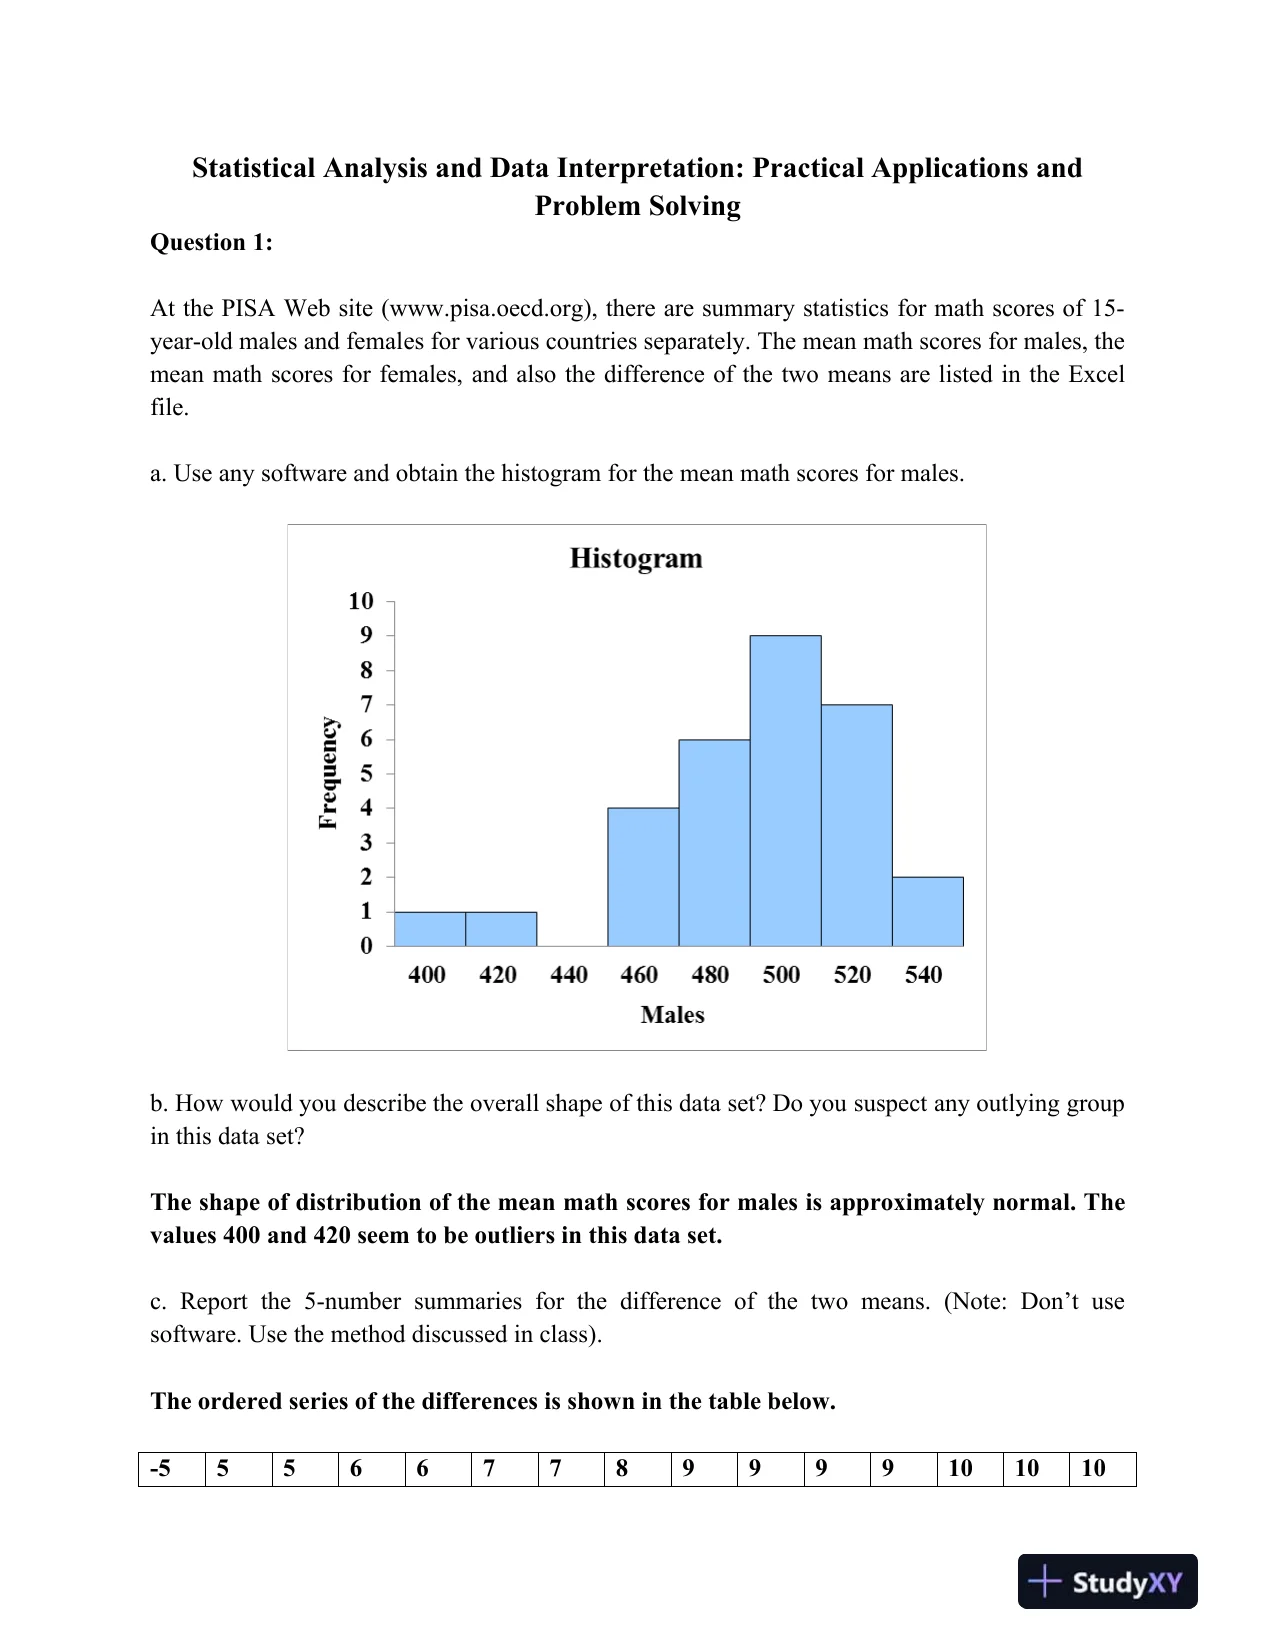
 Statistical Analysis and Data Interpretation: Practical Applications andProblem SolvingQuestion 1:At the PISA Web site (www.pisa.oecd.org), there are summary statistics formath scores of 15-year-old males and females for various countriesseparately. The meanmath scores for males, themean math scores for females, and also the difference of the twomeans are listed in the Excelfile.a. Use any software and obtain the histogram for the mean math scores for males.b. How would you describe the overall shape of this data set? Do you suspect any outlyinggroupin this data set?The shape of distribution of the mean math scores for males is approximately normal.Thevalues 400 and 420seemto be outliers in this data set.c. Reportthe 5-number summaries for the difference of the two means. (Note: Don’t usesoftware. Use the method discussed in class).The ordered series of the differences is shown in the table below.-555667789999101010
Preview Mode
This document has 11 pages. Sign in to access the full document!