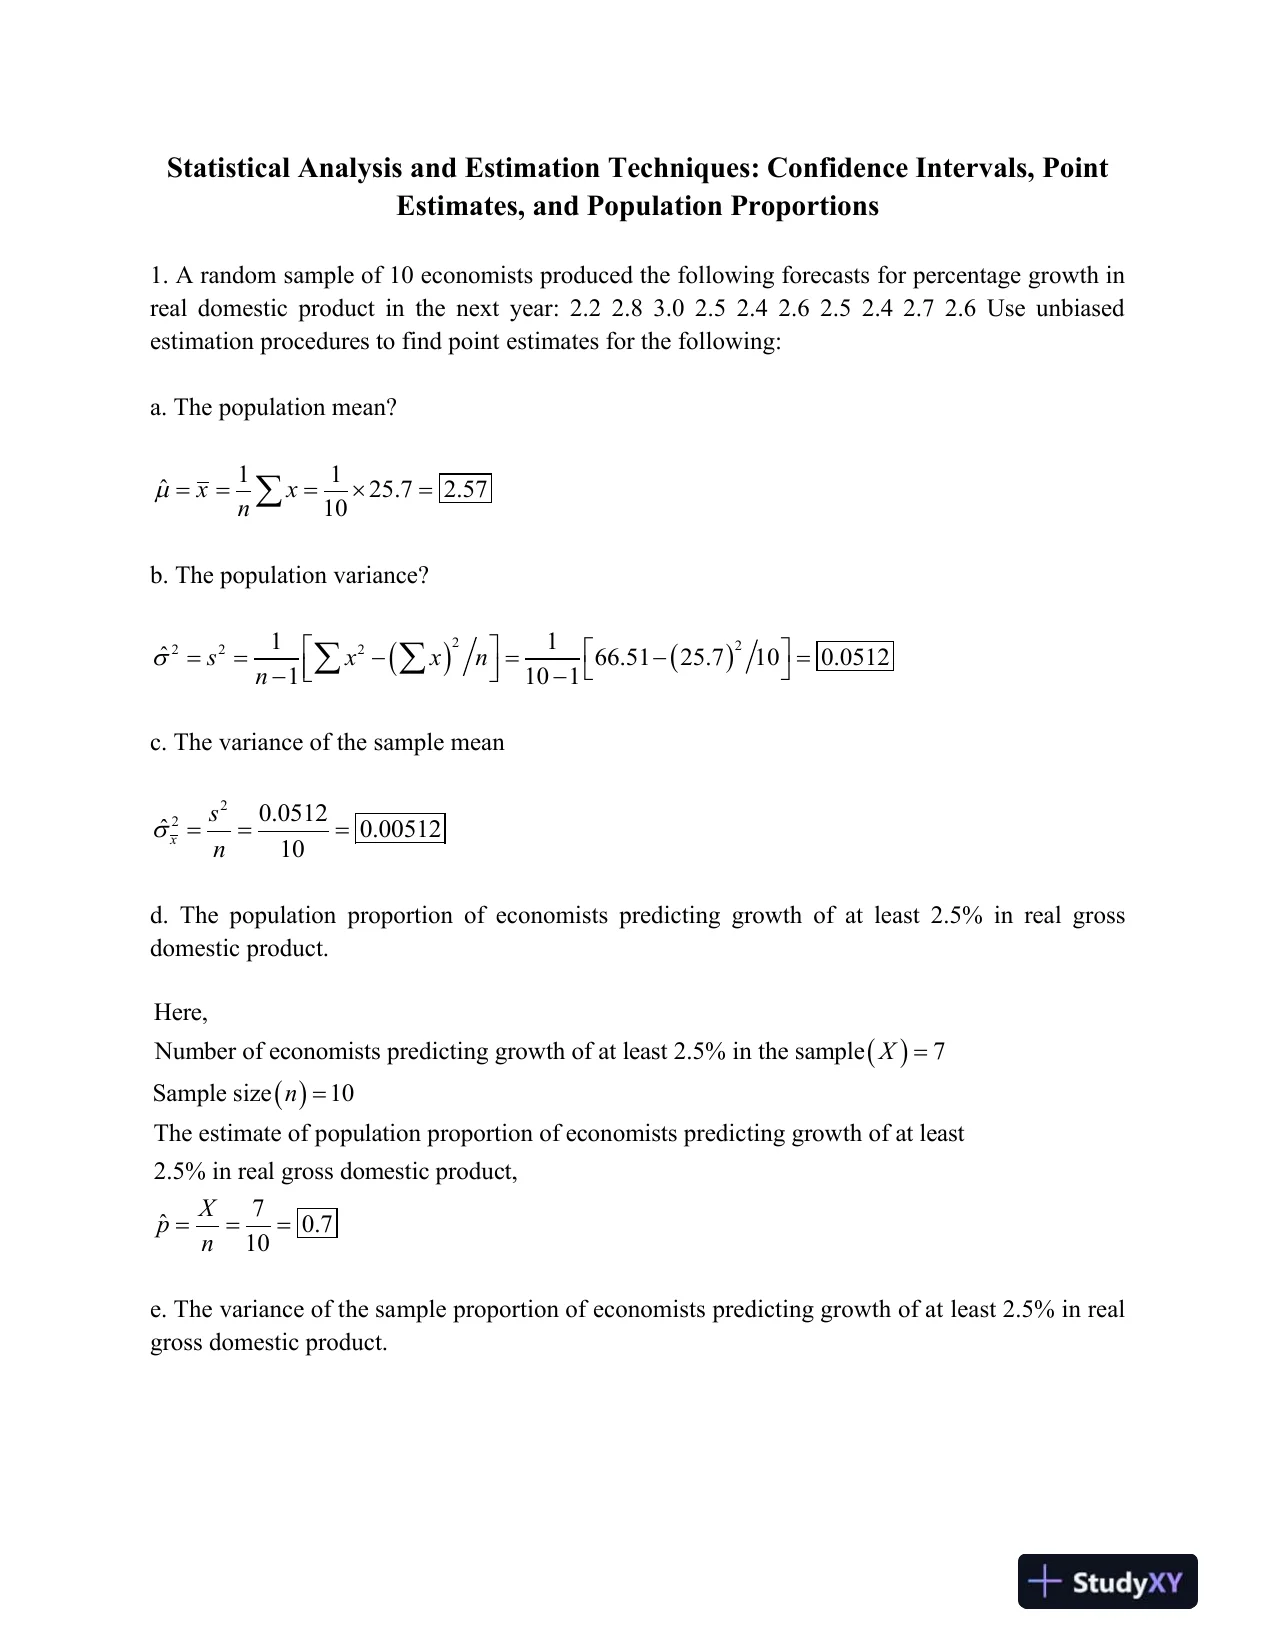
 Statistical Analysis and Estimation Techniques: Confidence Intervals, PointEstimates, and Population Proportions1. A random sample of 10 economists produced the following forecasts for percentagegrowth inreal domestic product in the next year: 2.22.8 3.0 2.5 2.4 2.6 2.5 2.4 2.7 2.6Use unbiasedestimation procedures to find point estimates for the following:a. The population mean?11ˆ25.72.5710xxn b. The population variance?2222211ˆ66.5125.7100.05121101sxxnnc. The variance of the sample mean220.0512ˆ0.0051210xsnd. The population proportion of economists predicting growth of at least 2.5% in realgrossdomestic product.Here,Number of economists predicting growth of at least 2.5% in the sample7Sample size10The estimate of population proportion of economists predicting growth of at least2.5% in real gross domesticXnproduct,7ˆ0.710Xpne. The variance of the sample proportion of economists predicting growth of at least2.5% in realgross domestic product.
Preview Mode
This document has 7 pages. Sign in to access the full document!