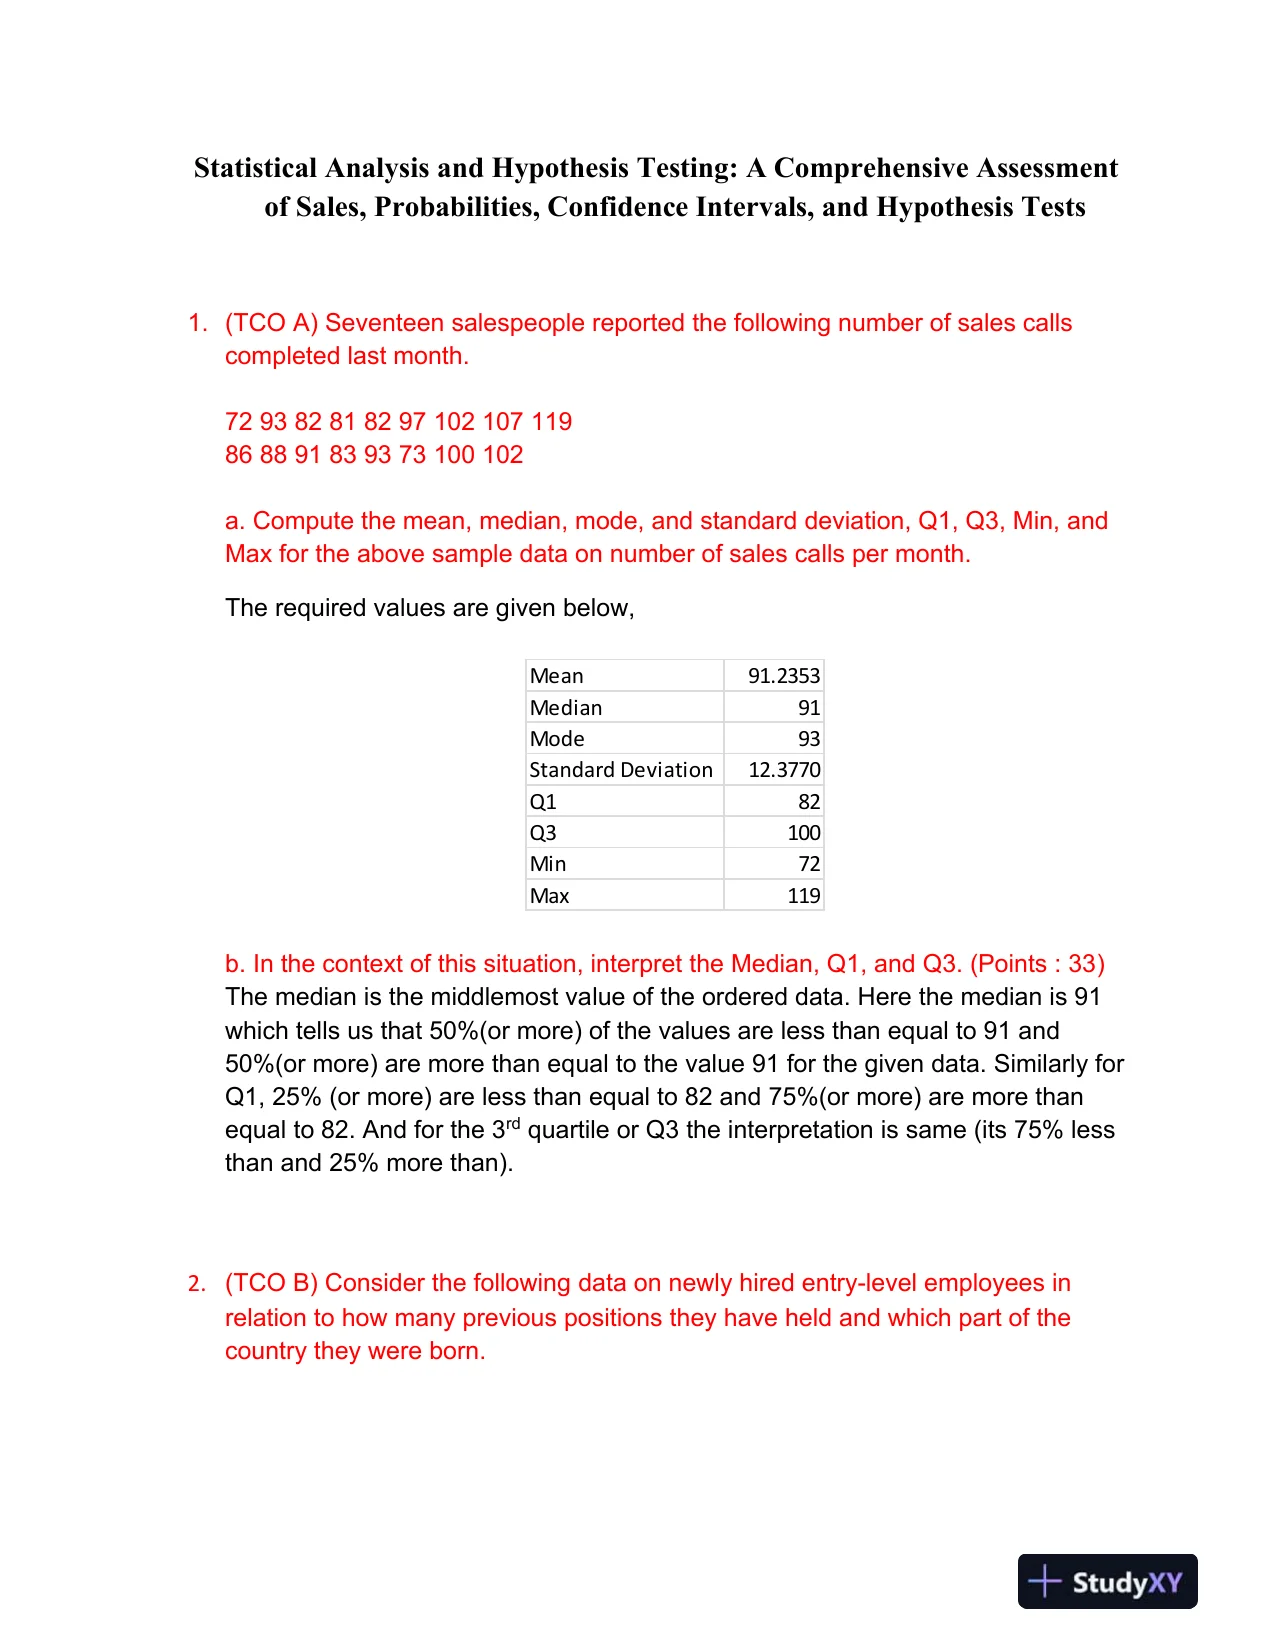
 Statistical Analysis and Hypothesis Testing: A Comprehensive Assessmentof Sales, Probabilities, Confidence Intervals, and Hypothesis Tests1.(TCO A) Seventeen salespeople reported the following number of sales callscompleted lastmonth.72 93 82 81 82 97 102 107 11986 88 91 83 93 73 100 102a. Compute the mean, median, mode, and standard deviation, Q1, Q3, Min, andMax for the above sample data on number of sales calls per month.The required values are given below,b. Inthe context of this situation, interpret the Median, Q1, and Q3. (Points : 33)The median is the middlemost value of the ordered data. Here the median is 91which tells us that 50%(or more) of the values are less than equal to 91 and50%(or more) are more than equal to the value 91 for the given data. Similarly forQ1, 25% (or more) are less than equal to 82 and 75%(or more) are more thanequal to82. And for the 3rdquartile or Q3 the interpretation is same (its 75% lessthan and 25% more than).2.(TCOB) Consider the following data on newly hired entry-level employees inrelation to how many previous positions they have held and which part of thecountry they were born.Mean91.2353Median91Mode93Standard Deviation12.3770Q182Q3100Min72Max119
Preview Mode
This document has 7 pages. Sign in to access the full document!