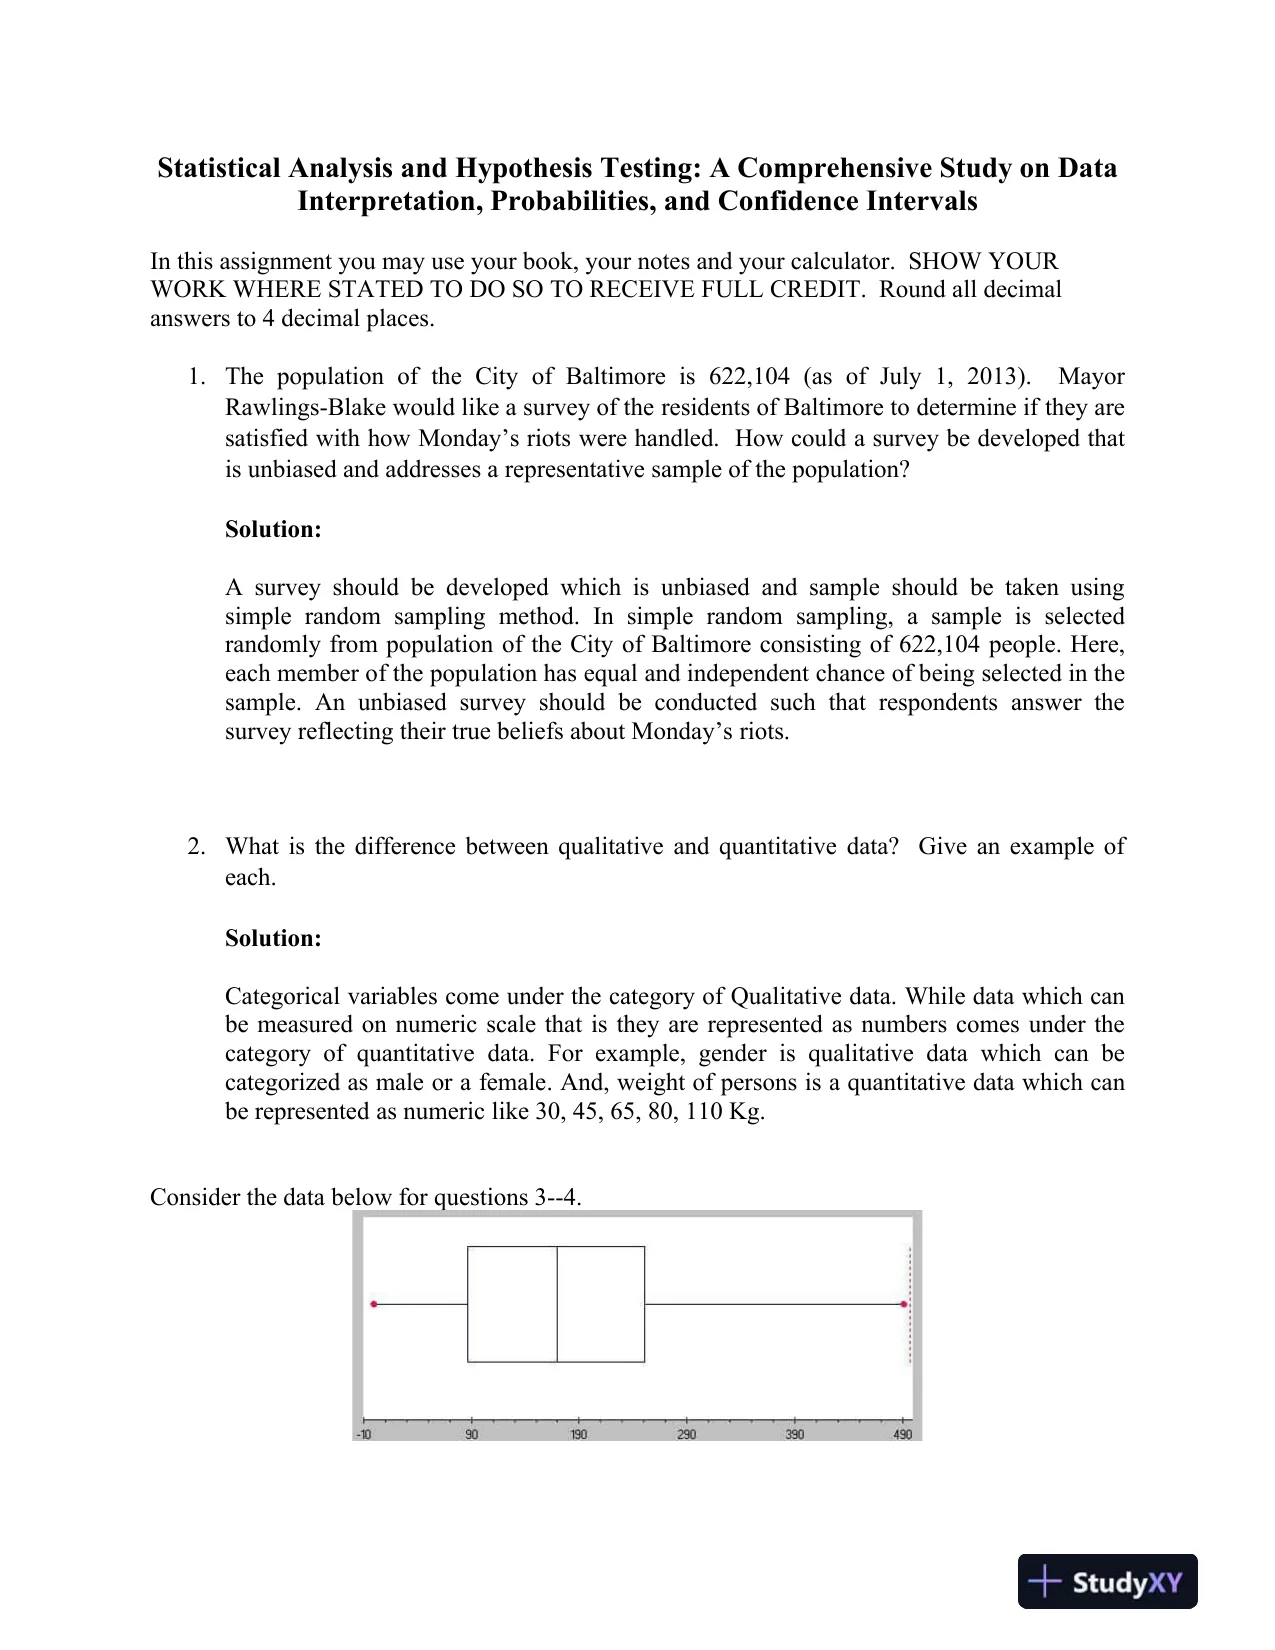
 Statistical Analysis and Hypothesis Testing: A Comprehensive Study on DataInterpretation, Probabilities, and Confidence IntervalsIn this assignment you may use your book, your notes and your calculator. SHOW YOURWORK WHERE STATED TO DO SO TORECEIVE FULL CREDIT. Round all decimalanswers to 4 decimal places.1.The population of the City of Baltimore is 622,104 (as of July 1, 2013).MayorRawlings-Blake would like a survey of the residents of Baltimore to determine if they aresatisfied with how Monday’s riots were handled.How could a survey be developed thatis unbiased and addresses a representative sample of the population?Solution:A survey should be developed which is unbiased and sample should be taken usingsimple random sampling method. In simple random sampling, a sample is selectedrandomly from population of the City of Baltimore consisting of 622,104 people. Here,each member of the population has equal and independent chance of being selected in thesample. An unbiased survey should be conducted such that respondents answer thesurvey reflecting their true beliefs about Monday’s riots.2.What is the difference between qualitative and quantitative data?Give an example ofeach.Solution:Categorical variables come under the category of Qualitative data. While data which canbe measured on numeric scale that is they are represented as numbers comes under thecategory of quantitative data.For example,genderis qualitative data which can becategorized asmale or a female.And,weightofpersonsis a quantitative data which canberepresentedasnumericlike30, 45, 65, 80, 110 Kg.Consider the data below for questions 3--4.
Preview Mode
This document has 14 pages. Sign in to access the full document!