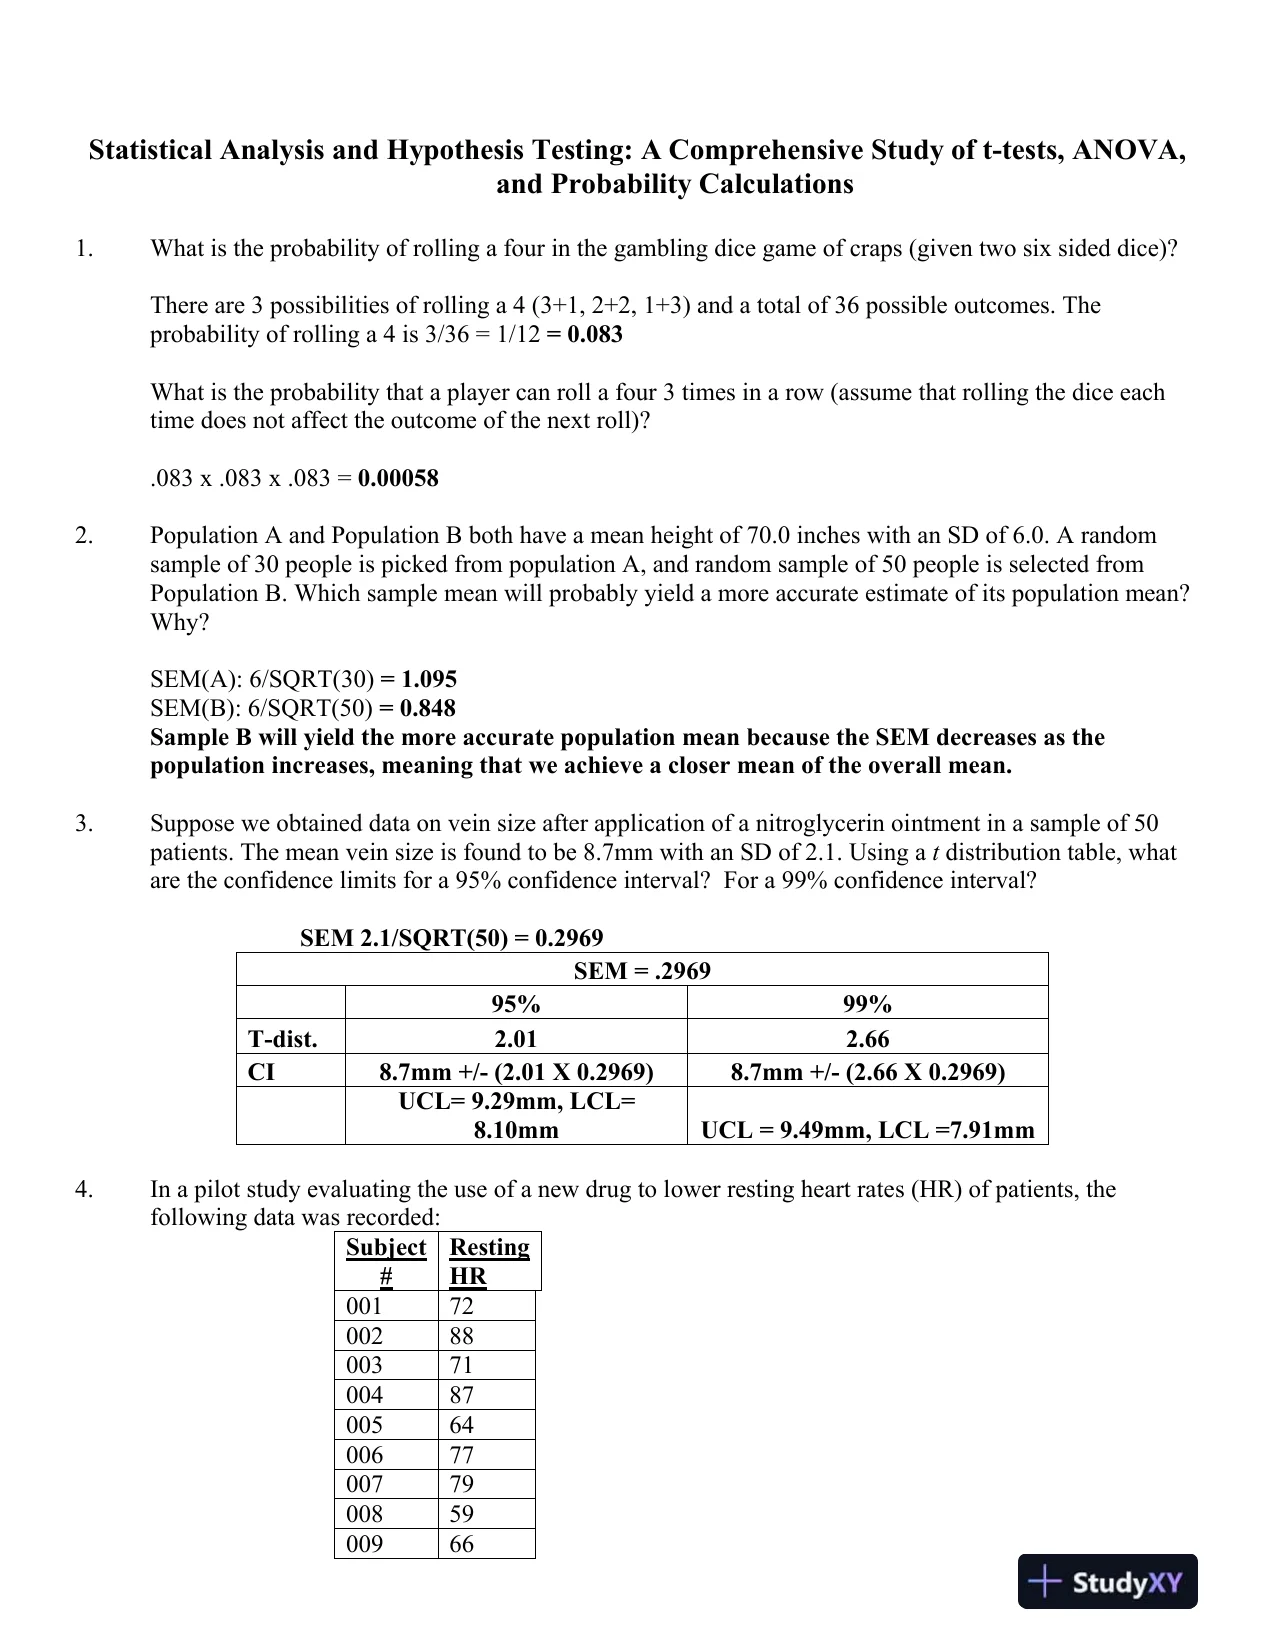
 Statistical Analysis and Hypothesis Testing: A Comprehensive Study of t-tests, ANOVA,and Probability Calculations1.What is the probability ofrolling a four in the gambling dice game of craps(given two six sided dice)?There are 3 possibilities of rolling a 4 (3+1, 2+2, 1+3) and a total of 36 possible outcomes. Theprobability of rolling a 4 is3/36= 1/12=0.083What is the probabilitythat a player can roll a four 3 times in a row (assume that rolling the dice eachtime does not affect the outcome of the next roll)?.083 x .083 x .083 =0.000582.Population A and Population B both have a mean height of70.0 inches with an SD of 6.0.A randomsample of 30 people is picked from population A, and random sample of 50 peopleis selected fromPopulation B.Which sample mean will probably yield a more accurate estimate of its population mean?Why?SEM(A): 6/SQRT(30)= 1.095SEM(B): 6/SQRT(50)= 0.848Sample B will yield the more accurate population mean because the SEM decreases as thepopulation increases, meaning that we achieve a closer mean of the overall mean.3.Suppose we obtained data on vein size after application of a nitroglycerin ointment in a sample of50patients.Themean vein size is found to be 8.7mm with an SD of 2.1. Using atdistribution table, whatare the confidence limits for a 95% confidence interval? For a 99% confidence interval?SEM 2.1/SQRT(50) = 0.2969SEM = .296995%99%T-dist.2.012.66CI8.7mm +/-(2.01 X 0.2969)8.7mm +/-(2.66 X 0.2969)UCL= 9.29mm, LCL=8.10mmUCL = 9.49mm, LCL =7.91mm4.In a pilot study evaluating the use of a new drug to lower resting heart rates (HR) of patients, thefollowing data was recorded:Subject#RestingHR001720028800371004870056400677007790085900966
Preview Mode
This document has 7 pages. Sign in to access the full document!