Statistical Analysis and Hypothesis Testing in Various Research Scenarios

Solved assignment covering hypothesis testing and statistical analysis in diverse research cases.

Andrew Taylor
Contributor
4.1
46
10 months ago
Preview (4 of 11 Pages)
100%
Log in to unlock

Page 1

Statistical Analysis and Hypothesis Testing in Various Research Scenarios - Page 1 preview image

Loading page ...

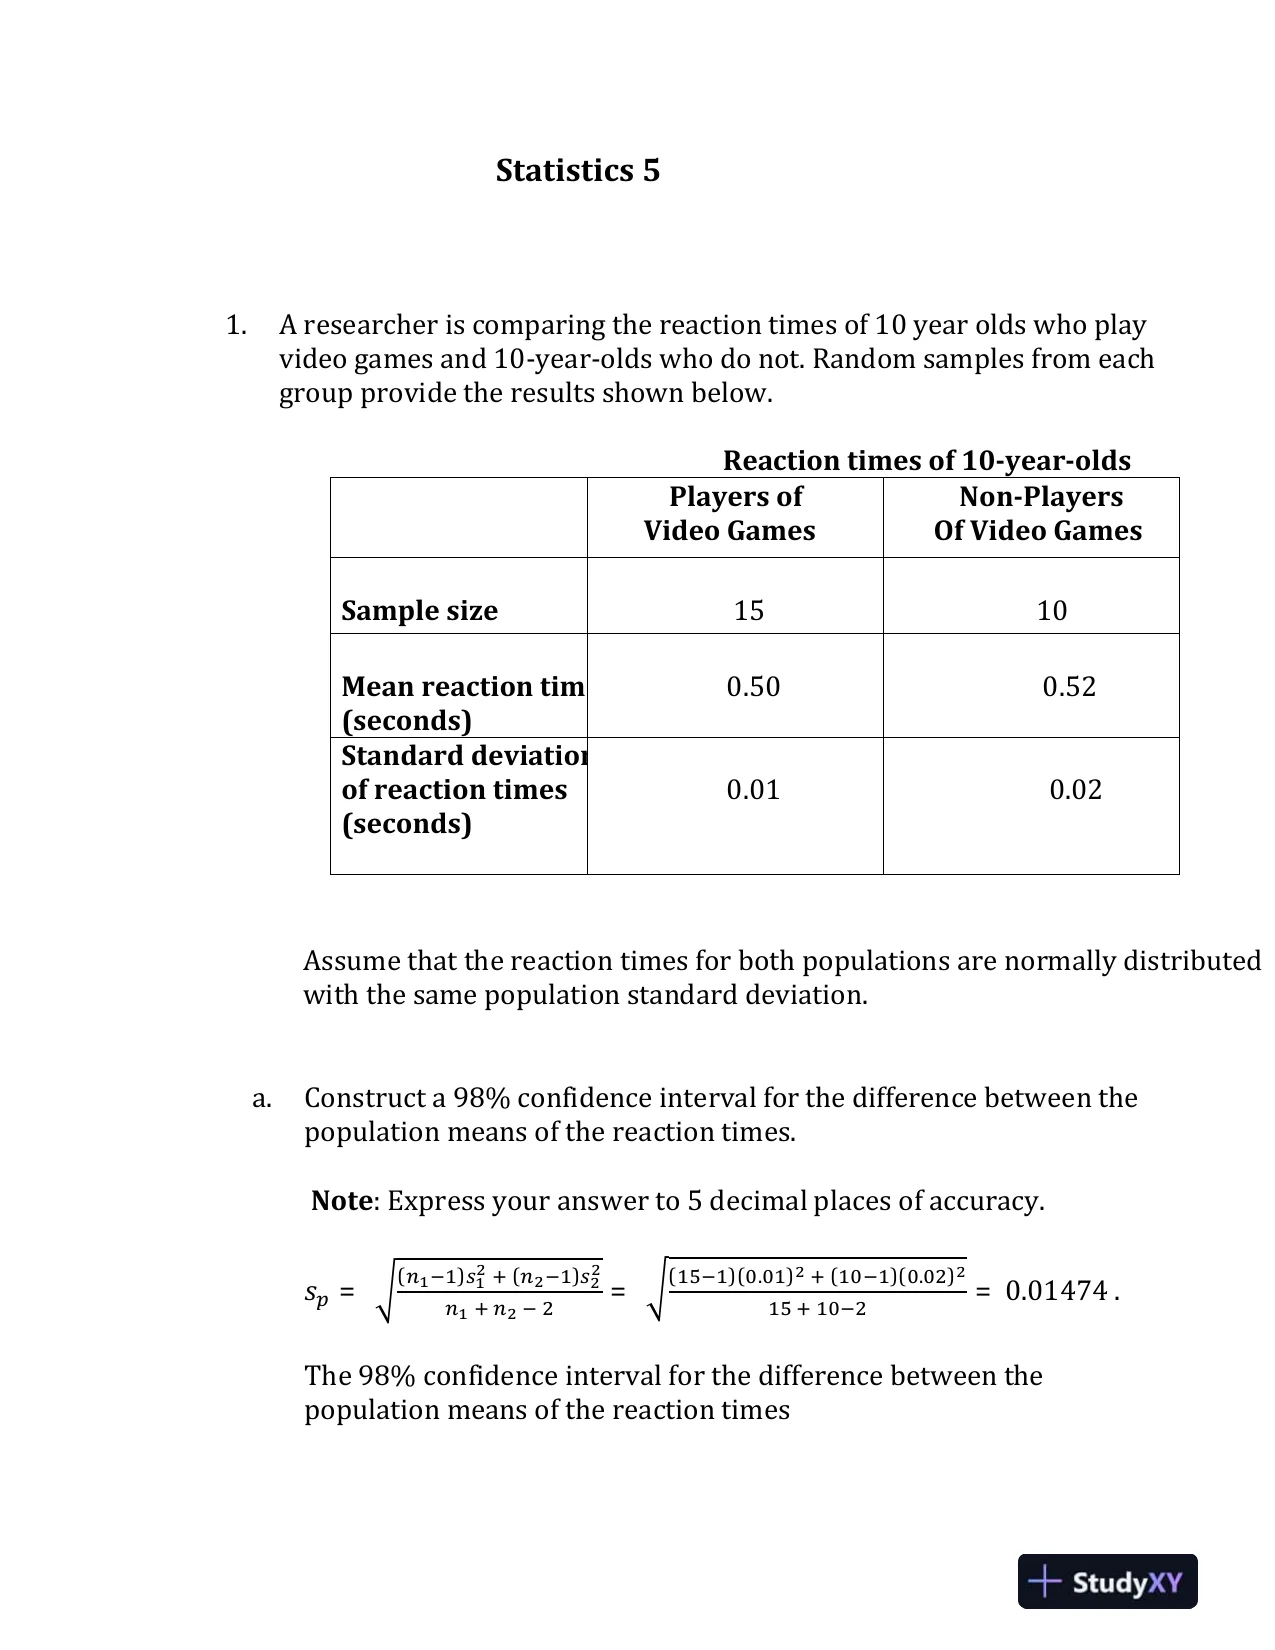
Statistics 51.A researcher is comparing the reaction times of 10 year olds who playvideogames and 10-year-olds who do not. Random samples from eachgroup provide the results shown below.Reaction times of 10-year-oldsPlayers ofVideo GamesNon-PlayersOf Video GamesSample size1510Mean reaction time(seconds)0.500.52Standard deviationof reaction times(seconds)0.010.02Assume that the reaction times for both populations are normally distributedwith the same population standard deviation.a.Construct a 98% confidence interval for the difference between thepopulation means of the reaction times.Note: Express your answer to 5 decimal places of accuracy.๐‘ ๐‘=เถง(๐‘›1โˆ’1)๐‘ 12+(๐‘›2โˆ’1)๐‘ 22๐‘›1+๐‘›2โˆ’2=เถง(15โˆ’1)(0.01)2+(10โˆ’1)(0.02)215+10โˆ’2=0.01474.The98% confidence interval for the difference between thepopulation means of the reaction times

Page 2

Statistical Analysis and Hypothesis Testing in Various Research Scenarios - Page 2 preview image

Loading page ...

Page 3

Statistical Analysis and Hypothesis Testing in Various Research Scenarios - Page 3 preview image

Loading page ...

แ‰Ž(๐’™เดฅ๐Ÿโˆ’๐’™เดฅ๐Ÿ)ยฑ๐’•๐œถ๐Ÿโ„,๐’๐Ÿ+๐’๐Ÿโˆ’๐Ÿ๐’”๐’‘เถจ๐Ÿ๐’๐Ÿ+๐Ÿ๐’๐Ÿแ‰=แ‰Ž(๐ŸŽ.๐Ÿ“๐ŸŽโˆ’๐ŸŽ.๐Ÿ“๐Ÿ)ยฑ๐’•๐ŸŽ.๐ŸŽ๐Ÿ,๐Ÿ๐Ÿ‘(๐ŸŽ.๐ŸŽ๐Ÿ๐Ÿ’๐Ÿ•๐Ÿ’)เถจ๐Ÿ๐Ÿ๐Ÿ“+๐Ÿ๐Ÿ๐ŸŽแ‰=[โˆ’๐ŸŽ.๐ŸŽ๐Ÿ๐ŸŽ๐ŸŽ๐ŸŽยฑ(๐Ÿ.๐Ÿ’๐Ÿ—๐Ÿ—๐Ÿ–๐Ÿ•)(๐ŸŽ.๐ŸŽ๐ŸŽ๐Ÿ”๐ŸŽ๐Ÿ)]=[โˆ’๐ŸŽ.๐ŸŽ๐Ÿ๐ŸŽ๐ŸŽ๐ŸŽยฑ๐ŸŽ.๐ŸŽ๐Ÿ๐Ÿ“๐ŸŽ๐Ÿ’]=[โˆ’๐ŸŽ.๐ŸŽ๐Ÿ‘๐Ÿ“๐ŸŽ๐Ÿ’,โˆ’๐ŸŽ.๐ŸŽ๐ŸŽ๐Ÿ’๐Ÿ—๐Ÿ”]b.Using a 2.5% significance level, can the researcher conclude that the meanreaction time of players of video games is less than the meanreaction timeof non-players of video games? Formulate and test the appropriatehypotheses. Use the critical value approach.Null hypothesis,H0:ฮผ1โ‰ฅฮผ2Alternative hypothesis,Ha:ฮผ1<ฮผ2Level of significance,ฮฑ= 0.025The critical value for this left-tailed t-test with๐’๐Ÿ+๐’๐Ÿโˆ’๐Ÿ=๐Ÿ๐Ÿ‘degrees of freedom at 2.5% significance level isโ€“2.0687.Test statistic,๐’•=(๐’™เดฅ๐Ÿโˆ’๐’™เดฅ๐Ÿ)๐’”๐’‘เถง๐Ÿ๐’๐Ÿ+๐Ÿ๐’๐Ÿ=๐ŸŽ.๐Ÿ“๐ŸŽโˆ’๐ŸŽ.๐Ÿ“๐Ÿ(๐ŸŽ.๐ŸŽ๐Ÿ๐Ÿ’๐Ÿ•๐Ÿ’)เถง๐Ÿ๐Ÿ๐Ÿ“+๐Ÿ๐Ÿ๐ŸŽ=โˆ’๐ŸŽ.๐ŸŽ๐Ÿ๐ŸŽ.๐ŸŽ๐ŸŽ๐Ÿ”๐ŸŽ๐Ÿ=โˆ’๐Ÿ‘.๐Ÿ‘๐Ÿ๐Ÿ‘๐Ÿ”Sinceโ€“3.3236 <โ€“2.0687, reject the null hypothesis.Therefore, at 2.5% significance level, the researcher canconclude thatthe mean reaction time of players of videogames is less than the meanreaction time of non-playersof video games.2.Is there any difference between the proportion of Americans who wish theywere rich and the proportion of Canadians who wish they were rich? A randomsample of 1,000 Americans showed that550 wish they were rich, while arandom sample of 500 Canadians showed that 225 wished they were rich.a.Find a 97.5% confidence interval for the difference between the population

Page 4

Statistical Analysis and Hypothesis Testing in Various Research Scenarios - Page 4 preview image

Loading page ...

proportions who wish they were rich.Note: Express your answer to 4 decimal places of accuracy.๐‘ฬ‚1=๐‘‹1๐‘›1=5501,000=0.55๐‘ฬ‚2=๐‘‹2๐‘›2=225500=0.45The 97.5% confidence interval for the difference between thePopulation proportions who wish they were rich:แ‰Ž(๐’‘เท๐Ÿโˆ’๐’‘เท๐Ÿ)ยฑ๐’๐œถ๐Ÿโ„เถจ๐’‘เท๐Ÿ(๐Ÿโˆ’๐’‘เท๐Ÿ)๐’๐Ÿ+๐’‘เท๐Ÿ(๐Ÿโˆ’๐’‘เท๐Ÿ)๐’๐Ÿแ‰=แ‰Ž(๐ŸŽ.๐Ÿ“๐Ÿ“โˆ’๐ŸŽ.๐Ÿ’๐Ÿ“)ยฑ๐’๐ŸŽ.๐ŸŽ๐Ÿ๐Ÿ๐Ÿ“เถจ๐ŸŽ.๐Ÿ“๐Ÿ“(๐Ÿโˆ’๐ŸŽ.๐Ÿ“๐Ÿ“)๐Ÿ,๐ŸŽ๐ŸŽ๐ŸŽ+๐ŸŽ.๐Ÿ’๐Ÿ“(๐Ÿโˆ’๐ŸŽ.๐Ÿ’๐Ÿ“)๐Ÿ“๐ŸŽ๐ŸŽแ‰=[๐ŸŽ.๐Ÿ๐ŸŽ๐ŸŽ๐ŸŽยฑ(๐Ÿ.๐Ÿ๐Ÿ’)(๐ŸŽ.๐ŸŽ๐Ÿ๐Ÿ•๐Ÿ)]=[๐ŸŽ.๐Ÿ๐ŸŽ๐ŸŽ๐ŸŽยฑ๐ŸŽ.๐ŸŽ๐Ÿ”๐Ÿ๐ŸŽ]=[๐ŸŽ.๐ŸŽ๐Ÿ‘๐Ÿ—๐ŸŽ,๐ŸŽ.๐Ÿ๐Ÿ”๐Ÿ๐ŸŽ]b.Test at the 1% level of significance, whether the twopopulation proportionsare significantly different. Formulate and test the appropriate hypotheses.Use the critical value approach.Null hypothesis,H0:p1=p2Alternative hypothesis,Ha:p1โ‰ p2Level of significance,ฮฑ= 0.01The critical valuesfor thistwo-tailedz-test at1% significance levelareโ€“2.576 and 2.576.Test statistic,๐’›=เตซ๐‘เท1โˆ’๐‘เท2เตฏเถจ๐’‘เท๐Ÿเตซ๐Ÿโˆ’๐’‘เท๐Ÿเตฏ๐’๐Ÿ+๐’‘เท๐Ÿเตซ๐Ÿโˆ’๐’‘เท๐Ÿเตฏ๐’๐Ÿ=๐ŸŽ.๐Ÿ“๐Ÿ“โˆ’๐ŸŽ.๐Ÿ’๐Ÿ“เถง๐ŸŽ.๐Ÿ“๐Ÿ“(๐Ÿโˆ’๐ŸŽ.๐Ÿ“๐Ÿ“)๐Ÿ,๐ŸŽ๐ŸŽ๐ŸŽ+๐ŸŽ.๐Ÿ’๐Ÿ“(๐Ÿโˆ’๐ŸŽ.๐Ÿ’๐Ÿ“)๐Ÿ“๐ŸŽ๐ŸŽ=๐ŸŽ.๐Ÿ๐ŸŽ๐ŸŽ.๐ŸŽ๐Ÿ๐Ÿ•๐Ÿ=๐Ÿ‘.๐Ÿ”๐Ÿ–
Preview Mode

This document has 11 pages. Sign in to access the full document!