Statistical Analysis and Hypothesis Testing: Regression, ANOVA, and Contingency Tables

Covers regression, ANOVA, and contingency tables.

Christopher Lee
Contributor
4.5
30
10 months ago
Preview (7 of 21 Pages)
100%
Log in to unlock

Page 1

Statistical Analysis and Hypothesis Testing: Regression, ANOVA, and Contingency Tables - Page 1 preview image

Loading page ...

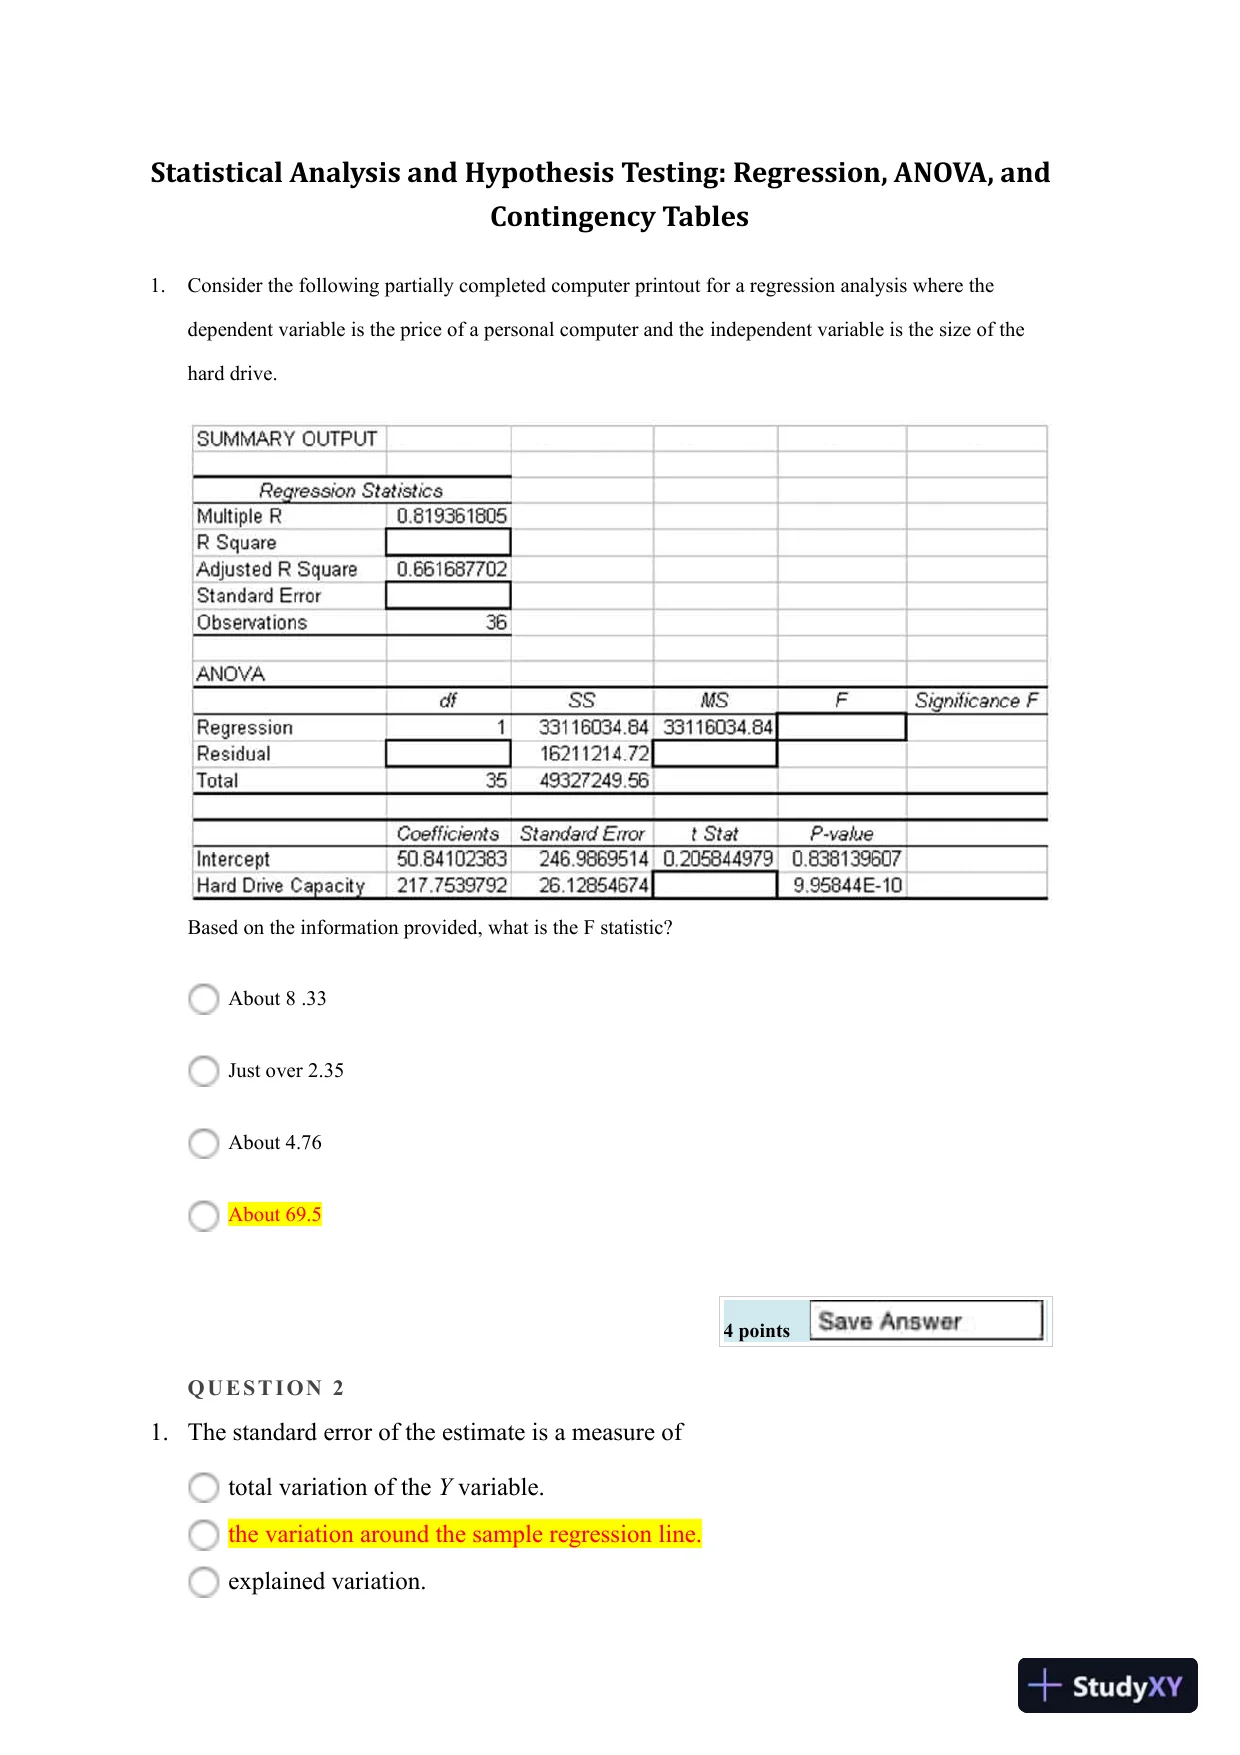
Statistical Analysis and Hypothesis Testing: Regression, ANOVA, andContingency Tables1.Consider the following partially completed computer printout for a regression analysis where thedependent variable is the price of a personal computer and theindependent variable is the size of thehard drive.Based on the information provided, what is the F statistic?About 8 .33Just over 2.35About 4.76About 69.54pointsQ U E S T I O N 21.The standard error of the estimate is a measure oftotal variation of theYvariable.the variation around the sample regression line.explained variation.

Page 2

Statistical Analysis and Hypothesis Testing: Regression, ANOVA, and Contingency Tables - Page 2 preview image

Loading page ...

Page 3

Statistical Analysis and Hypothesis Testing: Regression, ANOVA, and Contingency Tables - Page 3 preview image

Loading page ...

the variation of theXvariable.4pointsQ U E S T I O N 33.Nintendo Sony would like to test the hypothesis that a difference exists in the averageage ofusers of a Wii, a PlayStation, or an Xbox console game. The following datarepresent the age of a random sample of Wii, PlayStation, and Xbox users.WiiPlayStationXbox372631312120472438292431362530Usingα= 0.05, theconclusion for this hypothesis test would be that because the teststatistic ismore than the critical value, we cannot conclude that there is adifference in theaverage age of users of a Wii, a PlayStation, or an Xbox console game.less than the critical value, we cannot conclude that there is a difference in theaverage age of users of a Wii, a PlayStation, or an Xbox console game.more than the critical value, we can conclude thatthere is a difference in theaverage age of users of a Wii, a PlayStation, or an Xbox console game.less than the critical value, we can conclude that there is a difference in the averageage of users of a Wii, a PlayStation, or an Xbox console game.4pointsQ U E S T I O N 4

Page 4

Statistical Analysis and Hypothesis Testing: Regression, ANOVA, and Contingency Tables - Page 4 preview image

Loading page ...

1.The relationship of Y to four other variables was established as Y = 12 + 3X1-5X2 + 7X3 + 2X4.When X1 increases 5 units and X2 In a sample of n = 23, the Student's t test statistic for a correlation ofr = .500 would be:2.5592.8192.646can’tsaywithoutknowingα(alpha)4pointsQ U E S T I O N 51.Given the following ANOVA table (some information is missing), find the F statistic.3.710.990.4974.024pointsQ U E S T I O N 61.Examine the following two-factor analysis of variance table:

Page 5

Statistical Analysis and Hypothesis Testing: Regression, ANOVA, and Contingency Tables - Page 5 preview image

Loading page ...

Complete the analysis of variance table.MSA = 40.928, F Factor A =3.35, SSB = 85.35, Factor B df = 3, F Factor B = 2.316, MSAB =21.859, F Factor AB = 1.8, SSE = 789.29, SSE df = 66, MSE = 12.143MSA = 40.928, F Factor A = 3.35, SSB = 85.35, Factor B df = 4, F Factor B = 2.316, MSAB =21.859, F Factor AB = 2.1 SSE = 789.29, SSE df =66, MSE = 12.143MSA = 40.698, F Factor A = 3.35, SSB = 84.35, Factor B df = 5, F Factor B = 2.316, MSAB =21.859, F Factor AB = 2.1, SSE = 789.29, SSE df = 65, MSE = 12.143MSA = 40.698, F Factor A = 3.35, SSB = 84.35, Factor B df = 3, F Factor B = 2.316, MSAB =21.859, F Factor AB = 1.8, SSE =789.29, SSE df = 65, MSE = 12.1434pointsQ U E S T I O N 71.The critical value for a two-tailed test of H0: ß1 = 0 at a (alpha) =.05 in a simpleregression with 22 observations is:+ or-1.725+ or-2.086+ or-2.528+ or-1.9604points

Page 6

Statistical Analysis and Hypothesis Testing: Regression, ANOVA, and Contingency Tables - Page 6 preview image

Loading page ...

Q U E S T I O N 81.A regression equation that predicts the price of homes in thousands of dollars is t = 24.6 + 0.055x1-3.6x2, where x2 is a dummy variable that represents whether the house in on a busy street or not. Herex2 = 1means the house is on a busy street and x2 = 0 means it is not. Based on this information, whichof the following statements is true?On average, homes that are on busy streets are worth $3600 less than homes that are not on busystreets.On average, homes that are on busy streets are worth $3.6 less than homes that are not on busystreets.On average, homes that are on busy streets are worth $3600 more than homes that are not on busystreets.On average, homes that are on busy streets are worth $3.6 more than homes that are not on busystreets.4pointsQ U E S T I O N 91.The variation attributable to factors other than the relationship between the independentvariables andthe explained variable in a regression analysis is represented byregression sum of squares.error sum of squares.total sum of squares.regression mean squares.4pointsQ U E S T I O N 1 01.Degrees of freedom for the between-group variation in a one-factor ANOVA with n1 =8, n2 = 5, n3 = 7, n4 = 9 would be:28

Page 7

Statistical Analysis and Hypothesis Testing: Regression, ANOVA, and Contingency Tables - Page 7 preview image

Loading page ...

32944pointsQ U E S T I O N 1 11.A hypothesis test is conducted at the 5 percent level of significance to test whether thepopulation correlation is zero. If the sample consists of 25 observations and thecorrelation coefficient is 0.60, then the computed test statistic would be:2.0711.9603.5971.6454pointsQ U E S T I O N 1 21.A two-factoranalysis of variance is conducted to test the effect that price and advertising have on salesof a particular brand of bottled water. Each week a combination of particular levels of price andadvertising are used and the sales amount is recorded. The computer results are shown below.Based on the results above and a 0.05 level of significance, which of the following is correct?There is no interaction between price and advertising, so results for individual factors may be
Preview Mode

This document has 21 pages. Sign in to access the full document!