Statistical Analysis and Interpretation of Linear Regression Models Using R

Application of linear regression analysis and statistical modeling using R.

Christopher Lee
Contributor
4.6
53
10 months ago
Preview (4 of 13 Pages)
100%
Log in to unlock

Page 1

Statistical Analysis and Interpretation of Linear Regression Models Using R - Page 1 preview image

Loading page ...

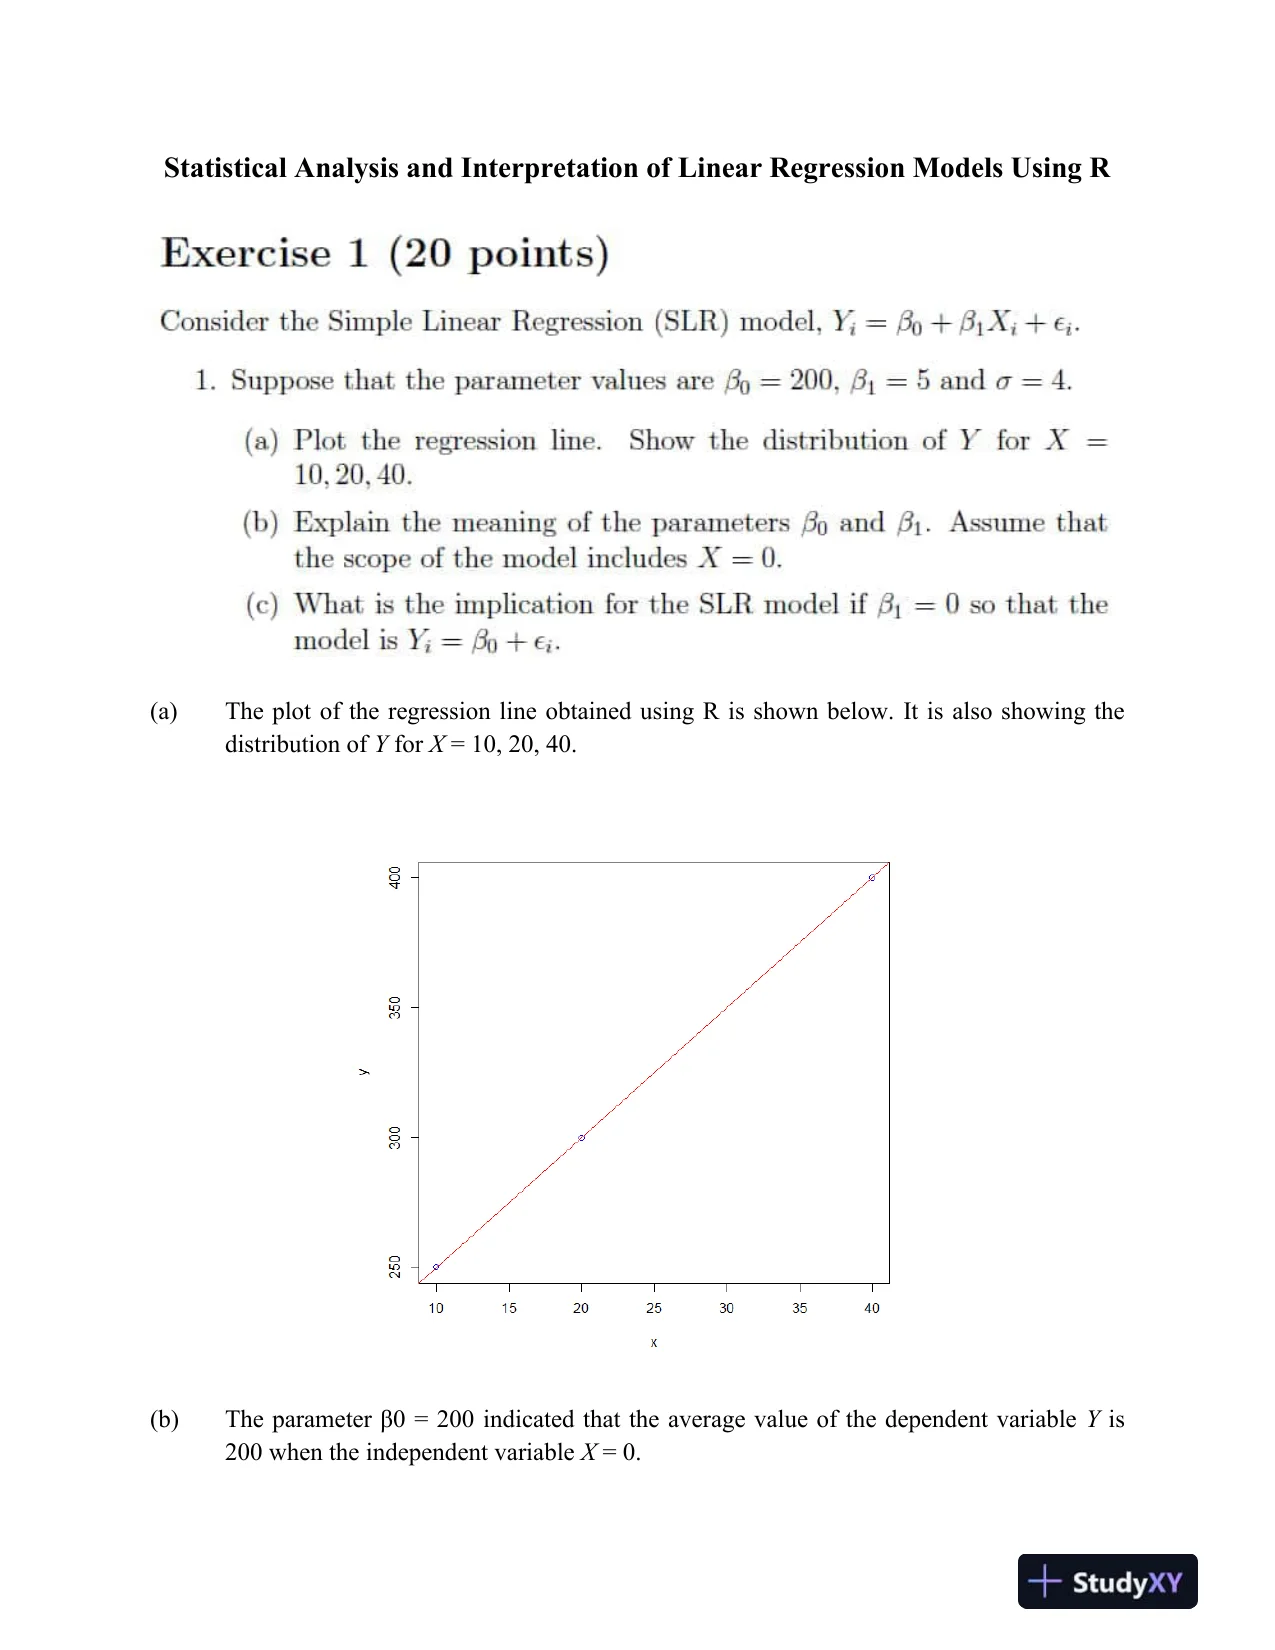
Statistical Analysis and Interpretation of Linear Regression Models Using R(a)The plotof the regression lineobtained using R is shown below.It is also showing thedistribution ofYforX= 10, 20, 40.(b)The parameter β0 = 200 indicated that the average value of the dependent variableYis200 when the independent variableX= 0.

Page 2

Statistical Analysis and Interpretation of Linear Regression Models Using R - Page 2 preview image

Loading page ...

Page 3

Statistical Analysis and Interpretation of Linear Regression Models Using R - Page 3 preview image

Loading page ...

The parameter β1 = 5 indicated that the increase in the dependent variableYis 5 units forevery one unit increase in the independent variableX.(c)If the slope of the regression model β1 = 0, then it can be concluded that there is aconstant growth β0 in the response variable for whatever variation in independentvariable exists. It indicated that there is no significant linear relationship betweenXandY.(a)Using the following R-code we can generate 100 random observations on predictorX.(b)Using the following R-code we can generate 100 random observations onresponsevariableY.(c)Using the following R-code we can construct the scatter plot forXandYgenerated aboveand calculate the correlation coefficient.

Page 4

Statistical Analysis and Interpretation of Linear Regression Models Using R - Page 4 preview image

Loading page ...

The correlation coefficient betweenXandYis,r=1.
Preview Mode

This document has 13 pages. Sign in to access the full document!