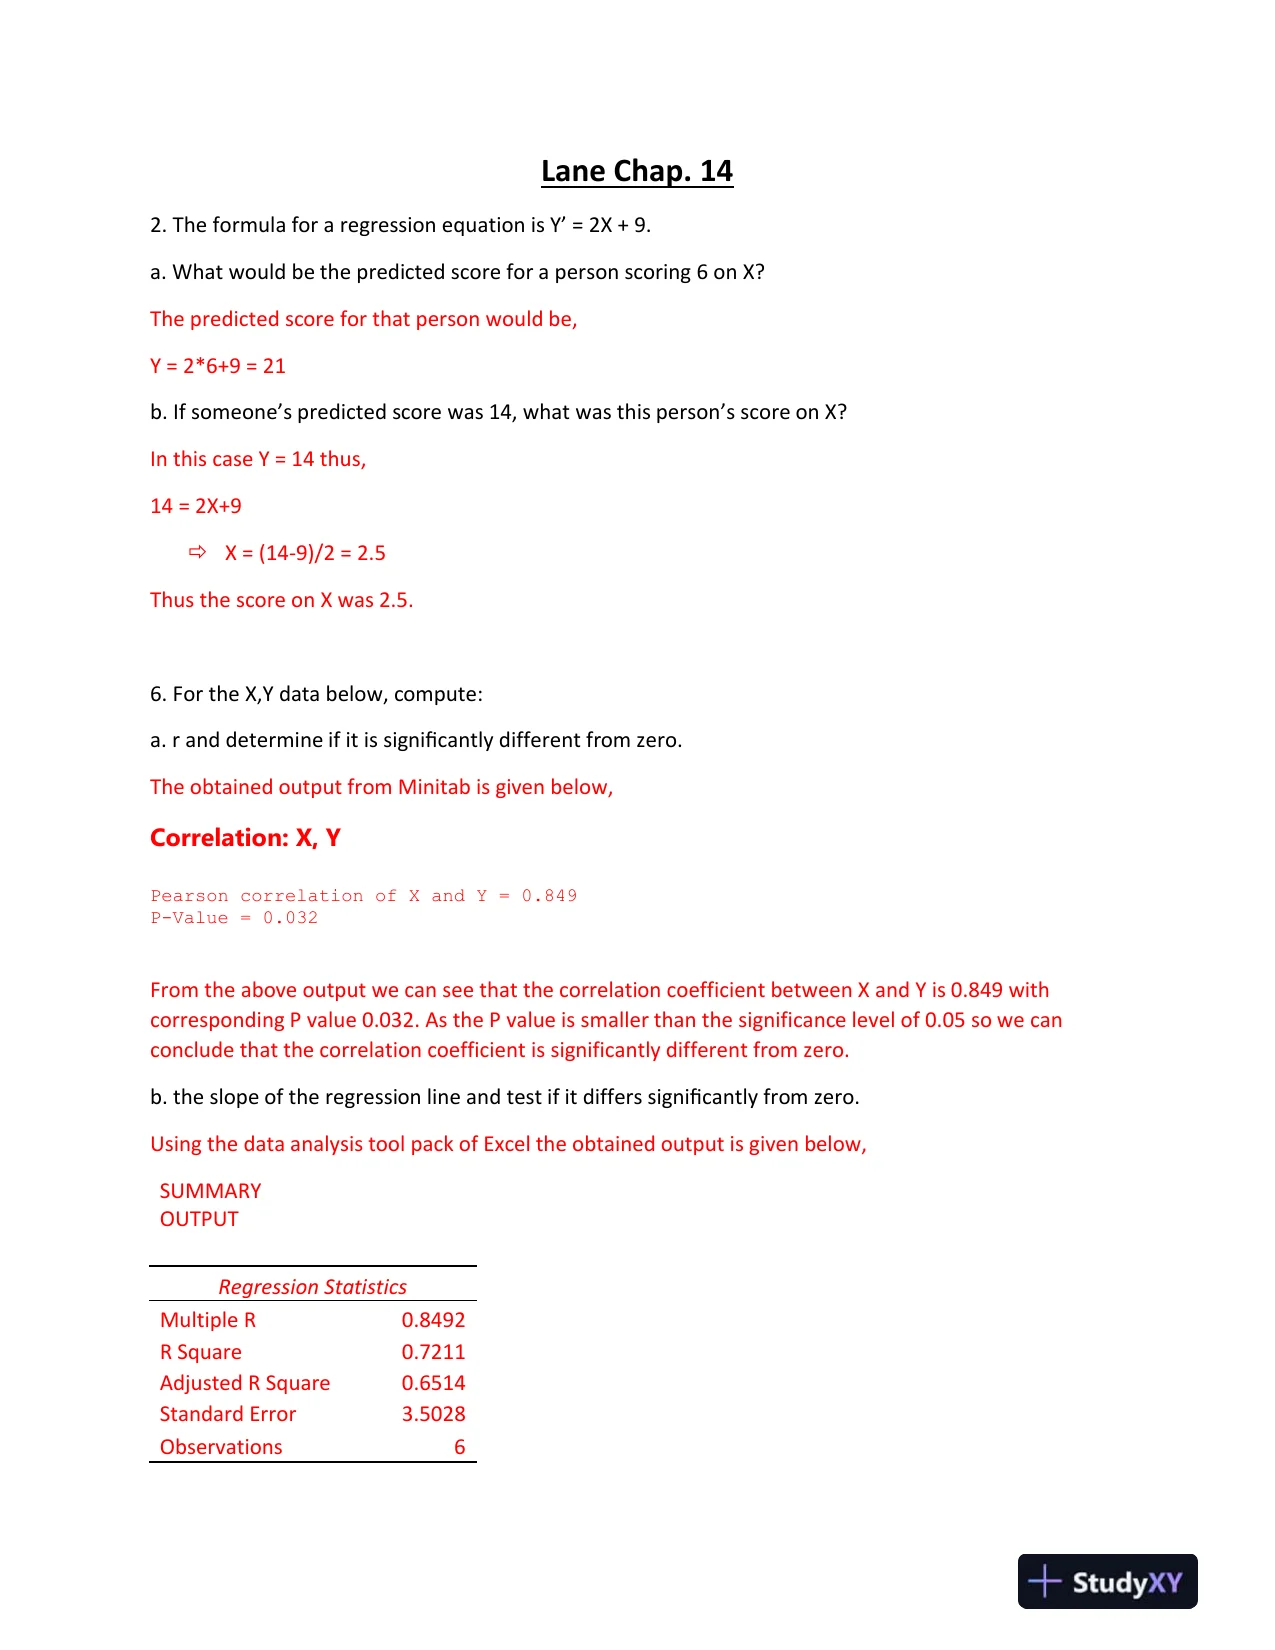
 Lane Chap. 142. The formula for a regression equation is Y’ = 2X + 9.a. What would be the predicted score for a person scoring 6 on X?The predicted score for that person would be,Y = 2*6+9 = 21b. If someone’s predicted score was 14, what was this person’s score on X?In this case Y = 14 thus,14 = 2X+9X = (14-9)/2 = 2.5Thus the score on X was 2.5.6. For the X,Y data below, compute:a. r and determine if it is significantly different from zero.The obtained output from Minitab is given below,Correlation: X, YPearsoncorrelationofXandY=0.849P-Value=0.032From the above output we can see that the correlation coefficient between X and Y is 0.849 withcorresponding P value 0.032. As the P value is smaller than the significance level of 0.05 so we canconclude that the correlation coefficient is significantly different from zero.b. the slope of the regression line and test if it differs significantly from zero.Using the data analysis tool pack of Excel the obtained output is given below,SUMMARYOUTPUTRegression StatisticsMultiple R0.8492R Square0.7211Adjusted R Square0.6514Standard Error3.5028Observations6
Preview Mode
This document has 7 pages. Sign in to access the full document!