CramX Logo
Statistical Analysis and Visualization of Data: Five Number Summary, Frequency Distribution, and Histogram - Document preview page 1

Statistical Analysis and Visualization of Data: Five Number Summary, Frequency Distribution, and Histogram - Page 1

Document preview content for Statistical Analysis and Visualization of Data: Five Number Summary, Frequency Distribution, and Histogram

Statistical Analysis and Visualization of Data: Five Number Summary, Frequency Distribution, and Histogram

A solved assignment on statistical data visualization techniques.

Olivia Smith
Contributor
4.7
0
12 months ago
Preview (2 of 4 Pages)
100%
Log in to unlock
Page 1 of 2
Statistical Analysis and Visualization of Data: Five Number Summary, Frequency Distribution, and Histogram - Page 1 preview image
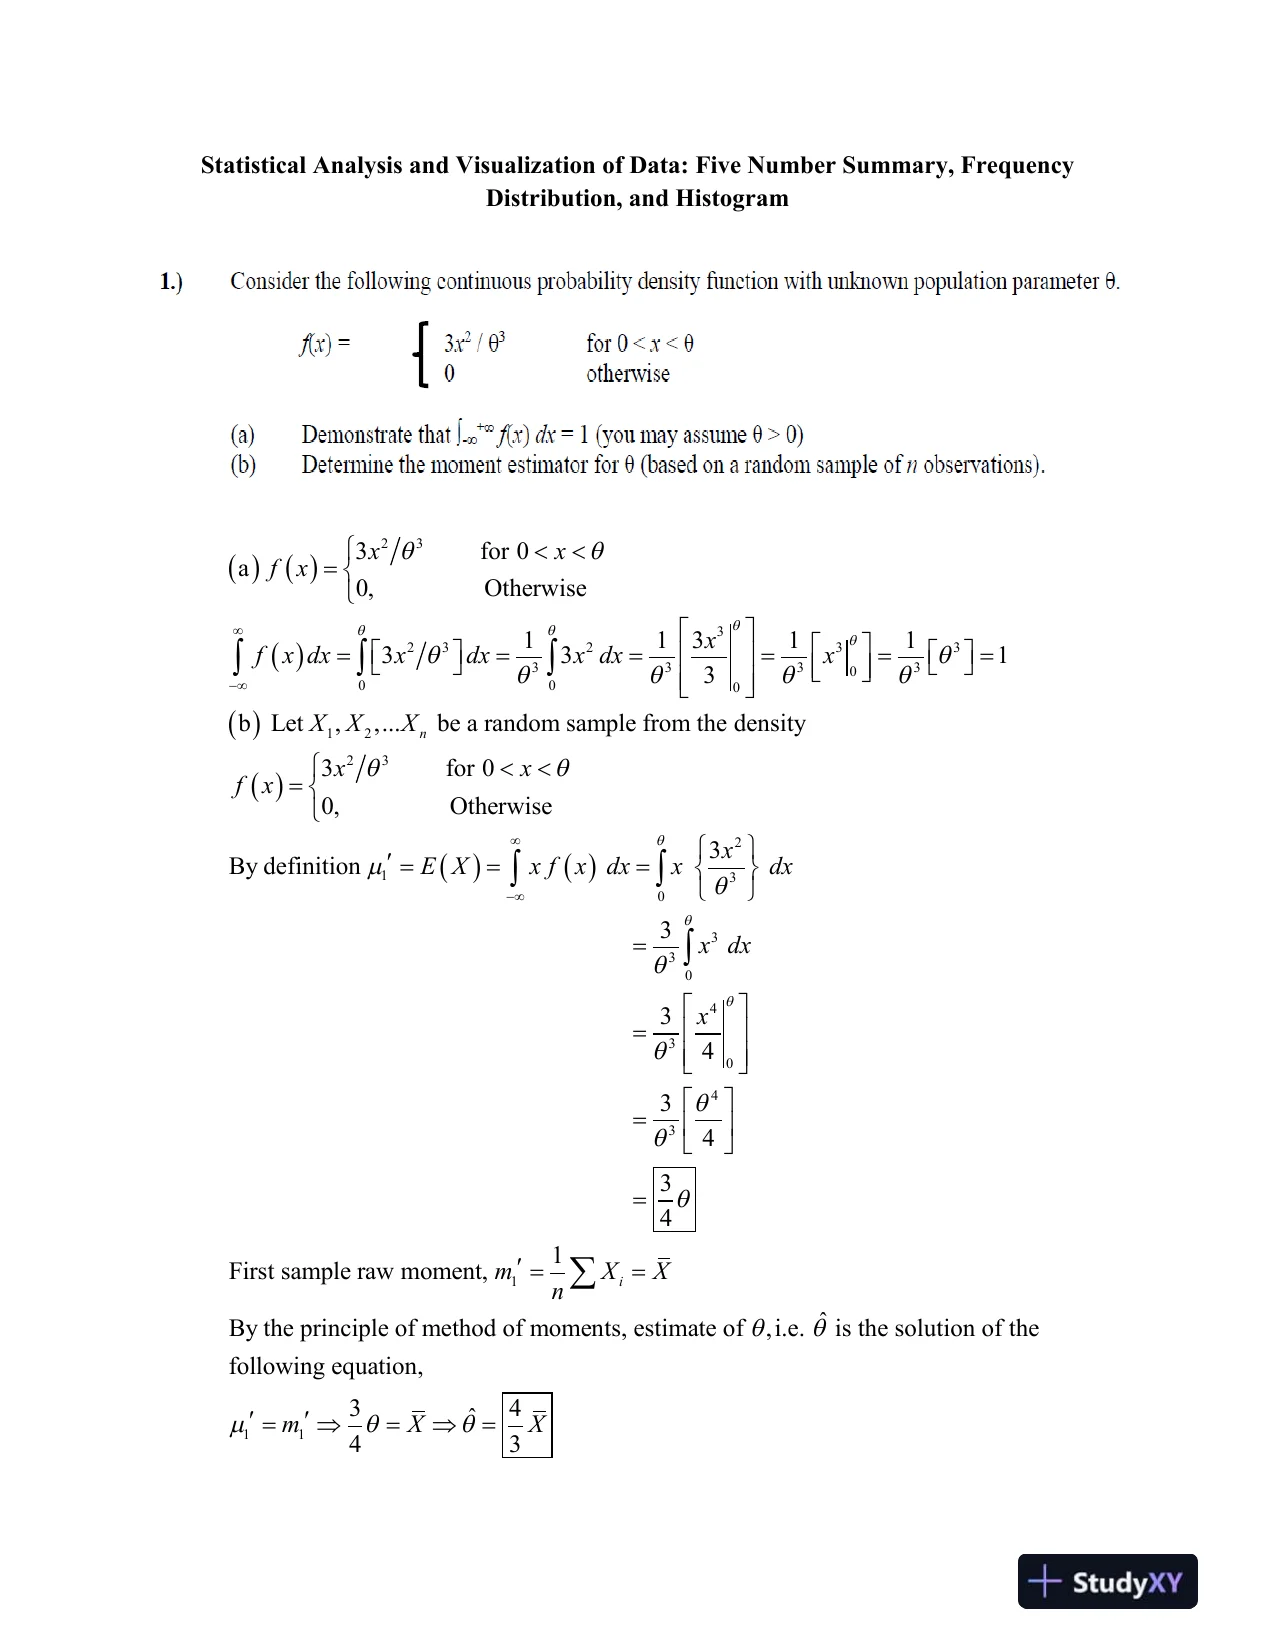
Statistical Analysis and Visualization of Data: Five Number Summary, FrequencyDistribution, and Histogram233232333333000012233for 0a0,Otherwise113113313bLet,,...be a random sample from the density3for 0nxxfxxfx dxxdxx dxxXXXxxfx 21303304304310,Otherwise3By definition33434341First sample raw moment,By the principle of method of momenixEXx fxdxxdxxdxxmXXn  11ˆts, estimate of,i.e.is the solution of thefollowing equation,34ˆ43mXX
Page 2 of 2
Statistical Analysis and Visualization of Data: Five Number Summary, Frequency Distribution, and Histogram - Page 2 preview image
Preview Mode

This document has 4 pages. Sign in to access the full document!