Statistical Analysis in Real Estate, Healthcare, and Marketing: ANOVA, Chi-Square, and Hypothesis Testing

Application of statistical analysis techniques in real-world business and healthcare scenarios.

Alexander Wilson
Contributor
4.3
51
10 months ago
Preview (8 of 25 Pages)
100%
Log in to unlock

Page 1

Statistical Analysis in Real Estate, Healthcare, and Marketing: ANOVA, Chi-Square, and Hypothesis Testing - Page 1 preview image

Loading page ...

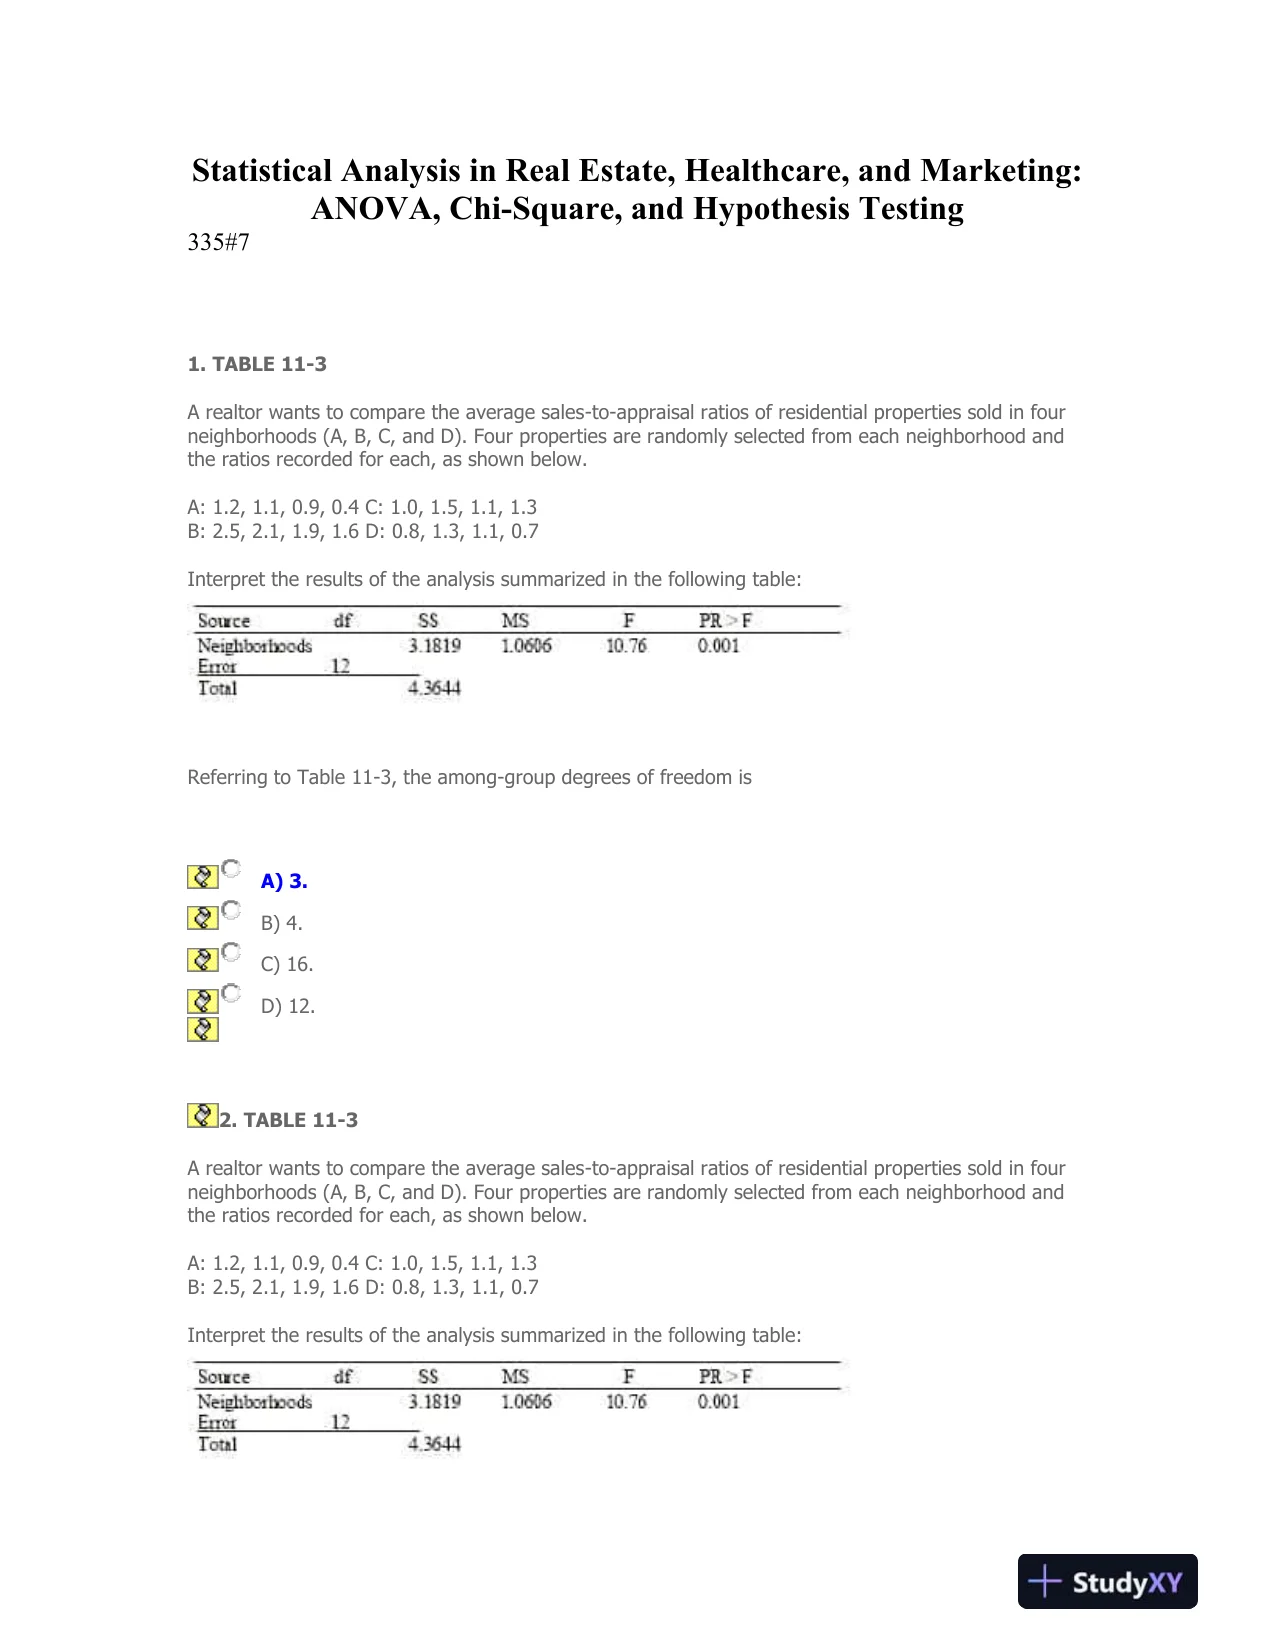
Statistical Analysis in Real Estate, Healthcare, and Marketing:ANOVA, Chi-Square, and Hypothesis Testing335#71.TABLE 11-3A realtor wants to compare the average sales-to-appraisal ratios of residential properties sold in fourneighborhoods (A, B, C, and D). Four properties are randomly selected from each neighborhood andthe ratios recorded for each, as shown below.A: 1.2, 1.1, 0.9, 0.4 C: 1.0, 1.5, 1.1, 1.3B: 2.5, 2.1, 1.9, 1.6 D: 0.8, 1.3, 1.1, 0.7Interpret the results of the analysis summarized in the following table:Referring to Table 11-3, the among-group degrees of freedom isA) 3.B) 4.C) 16.D) 12.2.TABLE 11-3A realtor wants to compare the average sales-to-appraisal ratios of residential properties sold in fourneighborhoods (A, B, C, and D). Four properties are randomly selected from each neighborhood andthe ratios recorded for each, as shown below.A: 1.2, 1.1, 0.9, 0.4 C: 1.0, 1.5, 1.1, 1.3B: 2.5, 2.1, 1.9, 1.6 D: 0.8, 1.3, 1.1, 0.7Interpret the results of the analysis summarized in the following table:

Page 2

Statistical Analysis in Real Estate, Healthcare, and Marketing: ANOVA, Chi-Square, and Hypothesis Testing - Page 2 preview image

Loading page ...

Page 3

Statistical Analysis in Real Estate, Healthcare, and Marketing: ANOVA, Chi-Square, and Hypothesis Testing - Page 3 preview image

Loading page ...

Referring to Table 11-3, the within-group sum of squares isA) 1.0606.B) 4.3644.C) 1.1825.D) 3.1819.3.A completely randomized designA) has one factor and one block and multiple values.B) can have more than one factor, each with several treatment groups.C) has one factor and one block.D) has only one factor with several treatment groups.4.TheFtest statistic in a one-way ANOVA isA) MSA/MSW.B) SSA/SSW.C) MSW/MSA.D) SSW/SSA.5.TABLE 11-2An airline wants to select a computer software package for its reservation system. Four softwarepackages (1, 2, 3, and 4) are commercially available. The airline will choose the package that bumpsas few passengers, on the average, as possible during a month. An experiment is set up in which eachpackage is used to make reservations for 5 randomly selected weeks. (A total of 20 weeks wasincluded in the experiment.) The number of passengers bumped each week is obtained, which givesrise to the following Excel output:ANOVA

Page 4

Statistical Analysis in Real Estate, Healthcare, and Marketing: ANOVA, Chi-Square, and Hypothesis Testing - Page 4 preview image

Loading page ...

Referring to Table 11-2, the within groups degrees of freedom isA) 19.B) 16.C) 4.D) 3.6.TABLE 11-5A physician and president of a Tampa Health Maintenance Organization (HMO) are attempting to showthe benefits of managed health care to an insurance company. The physician believes that certaintypes of doctors are more cost-effective than others. One theory is that Primary Specialty is animportant factor in measuring the cost-effectiveness of physicians. To investigate this, the presidentobtained independent random samples of 20 HMO physicians from each of 4 primary specialties-General Practice (GP),Internal Medicine (IM), Pediatrics (PED), and Family Physicians (FP)-andrecorded the total charges per member per month for each. A second factor which the presidentbelieves influences total charges per member per month is whether the doctor is a foreign or USAmedical school graduate. The president theorizes that foreign graduates will have higher meancharges than USA graduates. To investigate this, the president also collected data on 20 foreignmedical school graduates in each of the 4 primary specialty types described above. So information oncharges for 40 doctors (20 foreign and 20 USA medical school graduates) was obtained for each of the4 specialties. The results for the ANOVA are summarized in the following table.Referring to Table 11-5, what assumption(s) need(s) to be made in order to conduct the test fordifferences between the mean charges of foreign and USA medical school graduates?A) The charges in each group of doctors sampled are drawn from normally distributedpopulations.B) The charges in each group of doctors sampled are drawn from populations with equalvariances.

Page 5

Statistical Analysis in Real Estate, Healthcare, and Marketing: ANOVA, Chi-Square, and Hypothesis Testing - Page 5 preview image

Loading page ...

C) There is no significant interaction effect between the area of primary specialty and themedical school on the doctors' mean charges.D) All of the above are necessary assumptions.7.TABLE 12-2Many companies use well-known celebrities as spokespersons in their TV advertisements. A study wasconducted to determine whether brand awareness of female TV viewers and the gender of thespokesperson are independent. Each in a sample of 300 female TV viewers was asked to identify aproduct advertised by a celebrity spokesperson. The gender of the spokesperson and whether or notthe viewer could identify the product was recorded. The numbers in each category are given below.Referring to Table 12-2, at 5% level of significance, the critical value of the test statistic is:A) 3.8415B) 13.2767C) 5.9914D) 9.48778.TABLE 12-18An agronomist wants to compare the crop yield of 3 varieties of chickpea seeds. She plants all 3varieties of the seeds on each of 5 different patches of fields. She then measures the crop yield inbushels per acre. Treating this as a randomized block design, the results are presented in the tablethat follows.

Page 6

Statistical Analysis in Real Estate, Healthcare, and Marketing: ANOVA, Chi-Square, and Hypothesis Testing - Page 6 preview image

Loading page ...

Referring to Table 12-18, the null hypothesis for the Friedman rank test isA)H0:MField1=MField2=MField3=MField4=MField5B)H0:MSmith=MWalsh=MTrevorC)H0:μField1=μField2=μField3=μField4=μField5D)H0:μSmith=μWalsh=μTrevor9.TABLE 12-10Parents complain that children read too few storybooks and watch too much television nowadays. Asurvey of 1,000 children reveals the following information on average time spent watching TV andaverage time spent reading storybooks.Average time spent reading story books

Page 7

Statistical Analysis in Real Estate, Healthcare, and Marketing: ANOVA, Chi-Square, and Hypothesis Testing - Page 7 preview image

Loading page ...

Average timespent watchingTVLess than1 hourBetween1 and 2 hoursMore than2 hoursLess than 2 hours9085130More than 2 hours655328Referring to Table 12-10, we want to test whether there is any relationship between average timespent watching TV and average time spent reading storybooks. Suppose the value of the test statisticwas 164 (which isnotthe correct answer) and the critical value was 19.00 (which isnotthe correctanswer), then we could conclude thatA) there is no connection between time spent reading storybooks and time spent watchingTV.B) there is connection between time spent reading storybooks and time spentwatching TV.C) more time spent watching TV leads to less time spent reading storybooks.D) more time spent reading storybooks leads to less time spent watching TV.10.TABLE 12-3A computer used by a 24-hour banking service is supposed to randomly assign each transaction to oneof 5 memory locations. A check at the end of a day's transactions gave the counts shown in the tablefor each of the 5 memory locations, along with the number of reported errors.The bank manager wanted to test whether the proportion of errors in transactions assigned to each ofthe 5 memory locations differ.Referring to Table 12-3, the critical value of the test statistic at 1% level of significance is:A) 13.2767B) 7.7794C) 23.2093D) 20.0902

Page 8

Statistical Analysis in Real Estate, Healthcare, and Marketing: ANOVA, Chi-Square, and Hypothesis Testing - Page 8 preview image

Loading page ...

11.When testing for independence in a contingency table with 3 rows and 4 columns, there are________ degrees of freedom.A) 12B) 5C) 7D) 612.TABLE 13-1A large national bank charges local companies for using their services. A bank official reported theresults of a regression analysis designed to predict the bank's charges (Y)measured in dollars permonthfor services rendered to local companies. One independent variable used to predict theservice charge to a company is the company's sales revenue (X)measured in millions of dollars. Datafor 21 companies who use the bank's services were used to fit the model:E(Y) =β0+β1XThe results of the simple linear regression are provided below.=-2,700 + 20X, SYX= 65,two-tailedpvalue = 0.034 (for testingβ1)Referring to Table 13-1, interpret the estimate of σ, the standard deviation of the random error term(standard error of the estimate) in the model.A) For every $1 million increase in sales revenue, we expect a service charge to increase $65.B) About 95% of the observed service charges equal their corresponding predicted values.C) About 95% of the observed service charges fall within $130 of the least squaresline.D) About 95% of the observed service charges fall within $65 of the least squares line.13.In a simple linear regression problem,randb1A) must have opposite signs.
Preview Mode

This document has 25 pages. Sign in to access the full document!