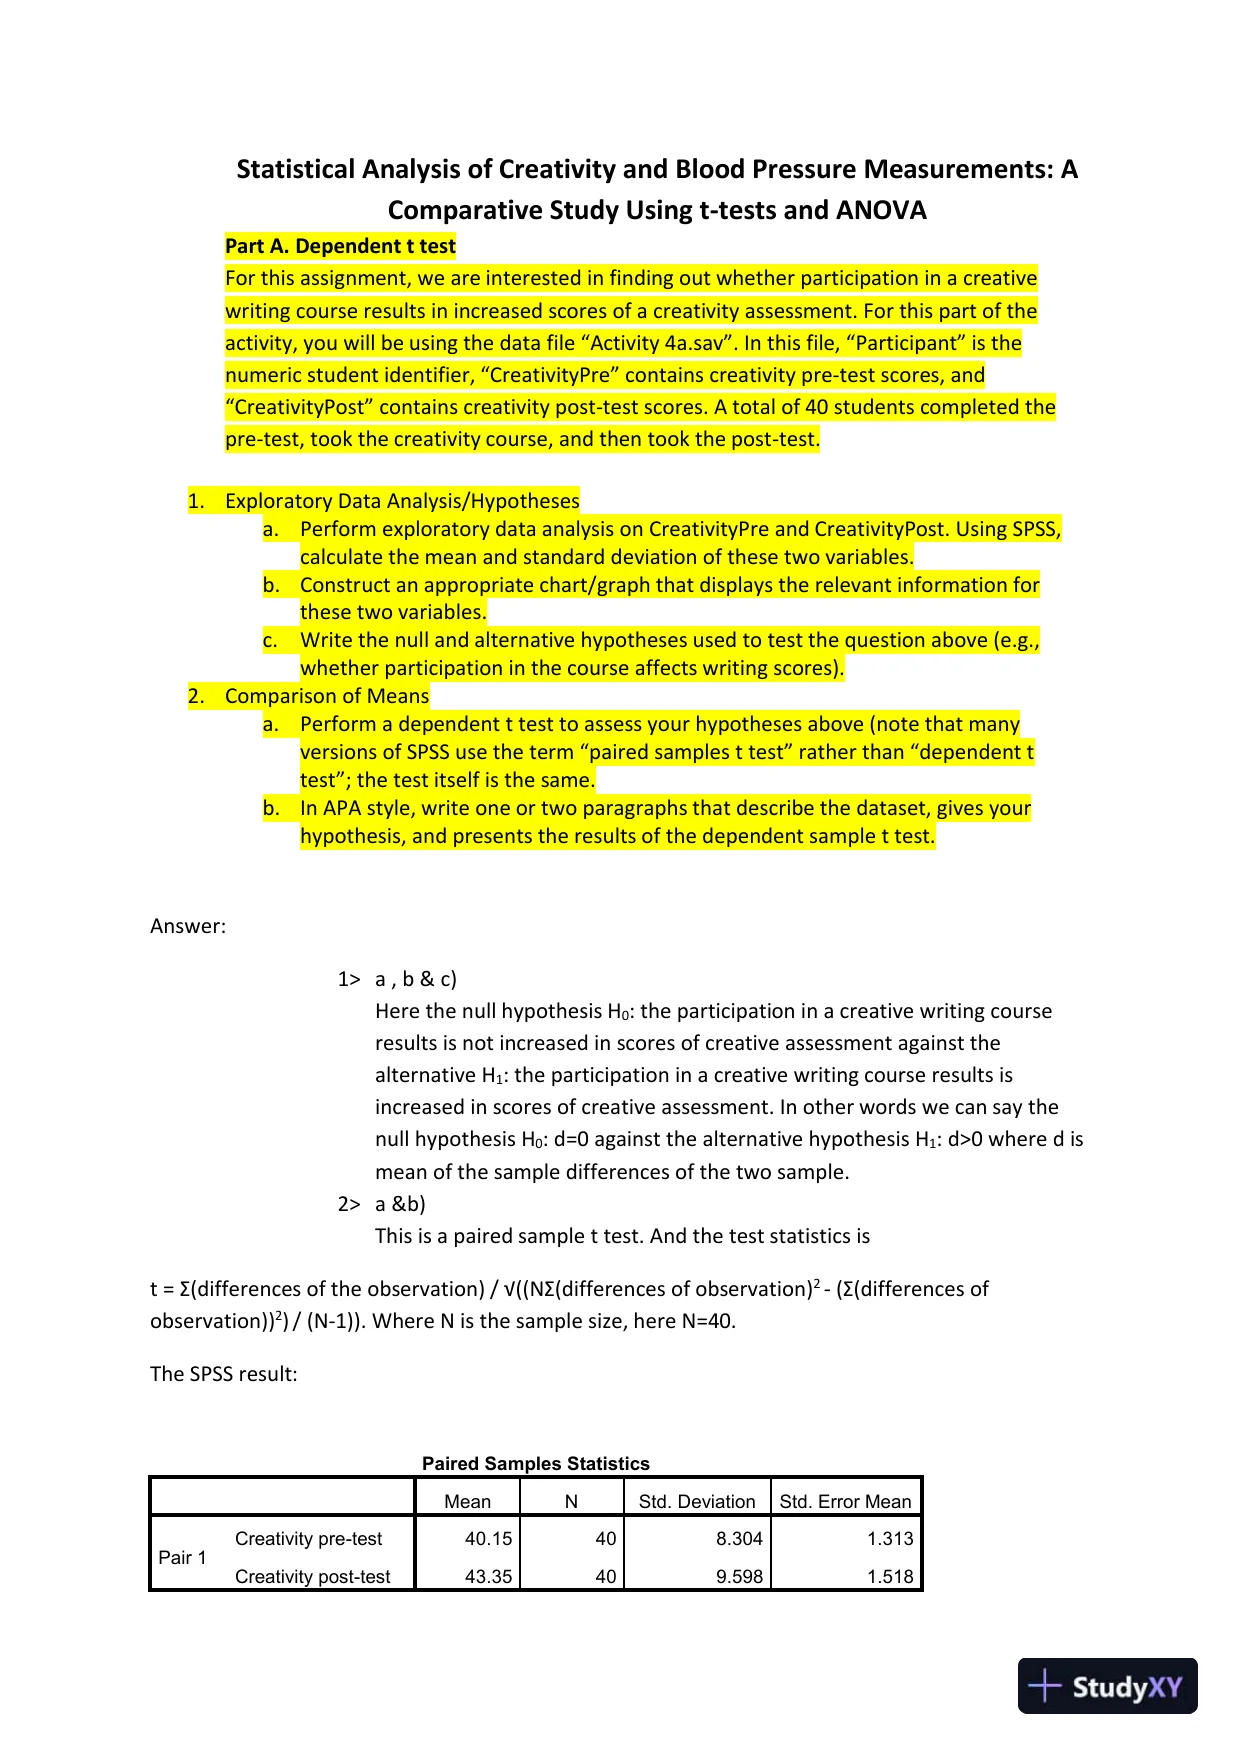
 Statistical Analysis of Creativity and Blood Pressure Measurements: AComparative Study Using t-tests and ANOVAPart A. Dependent t testFor this assignment, we are interested in finding out whether participation in a creativewriting courseresults in increased scores of a creativity assessment. For this part of theactivity, you will be using the data file “Activity 4a.sav”. In this file, “Participant” is thenumeric student identifier, “CreativityPre” contains creativity pre-test scores, and“CreativityPost” contains creativity post-test scores. A total of 40 students completed thepre-test, took the creativity course, and then took the post-test.1.Exploratory Data Analysis/Hypothesesa.Perform exploratory data analysis on CreativityPre and CreativityPost. Using SPSS,calculate the mean and standard deviation of these two variables.b.Construct an appropriate chart/graph that displays the relevant information forthese two variables.c.Write the null and alternative hypotheses used to test the question above (e.g.,whether participation in the course affects writing scores).2.Comparison of Meansa.Perform a dependent t test to assess your hypotheses above (note that manyversions of SPSS use the term “paired samples t test” rather than “dependent ttest”; the test itself is the same.b.In APA style, write one or two paragraphs that describe the dataset, gives yourhypothesis, and presents the results of the dependent sample t test.Answer:1>a , b & c)Here the null hypothesis H0: the participation in a creative writing courseresults is not increased in scores of creative assessment against thealternative H1: the participation in a creative writing course results isincreased in scores of creative assessment. In other words we can say thenull hypothesis H0: d=0 against the alternative hypothesis H1: d>0 where d ismean of the sample differences of the two sample.2>a &b)This is a paired sample t test. And the test statistics ist =Σ(differences of the observation)/√((NΣ(differences of observation)2-(Σ(differences ofobservation))2)/ (N-1)). Where N is the sample size, here N=40.The SPSS result:Paired Samples StatisticsMeanNStd. DeviationStd. Error MeanPair 1Creativity pre-test40.15408.3041.313Creativity post-test43.35409.5981.518
Preview Mode
This document has 9 pages. Sign in to access the full document!