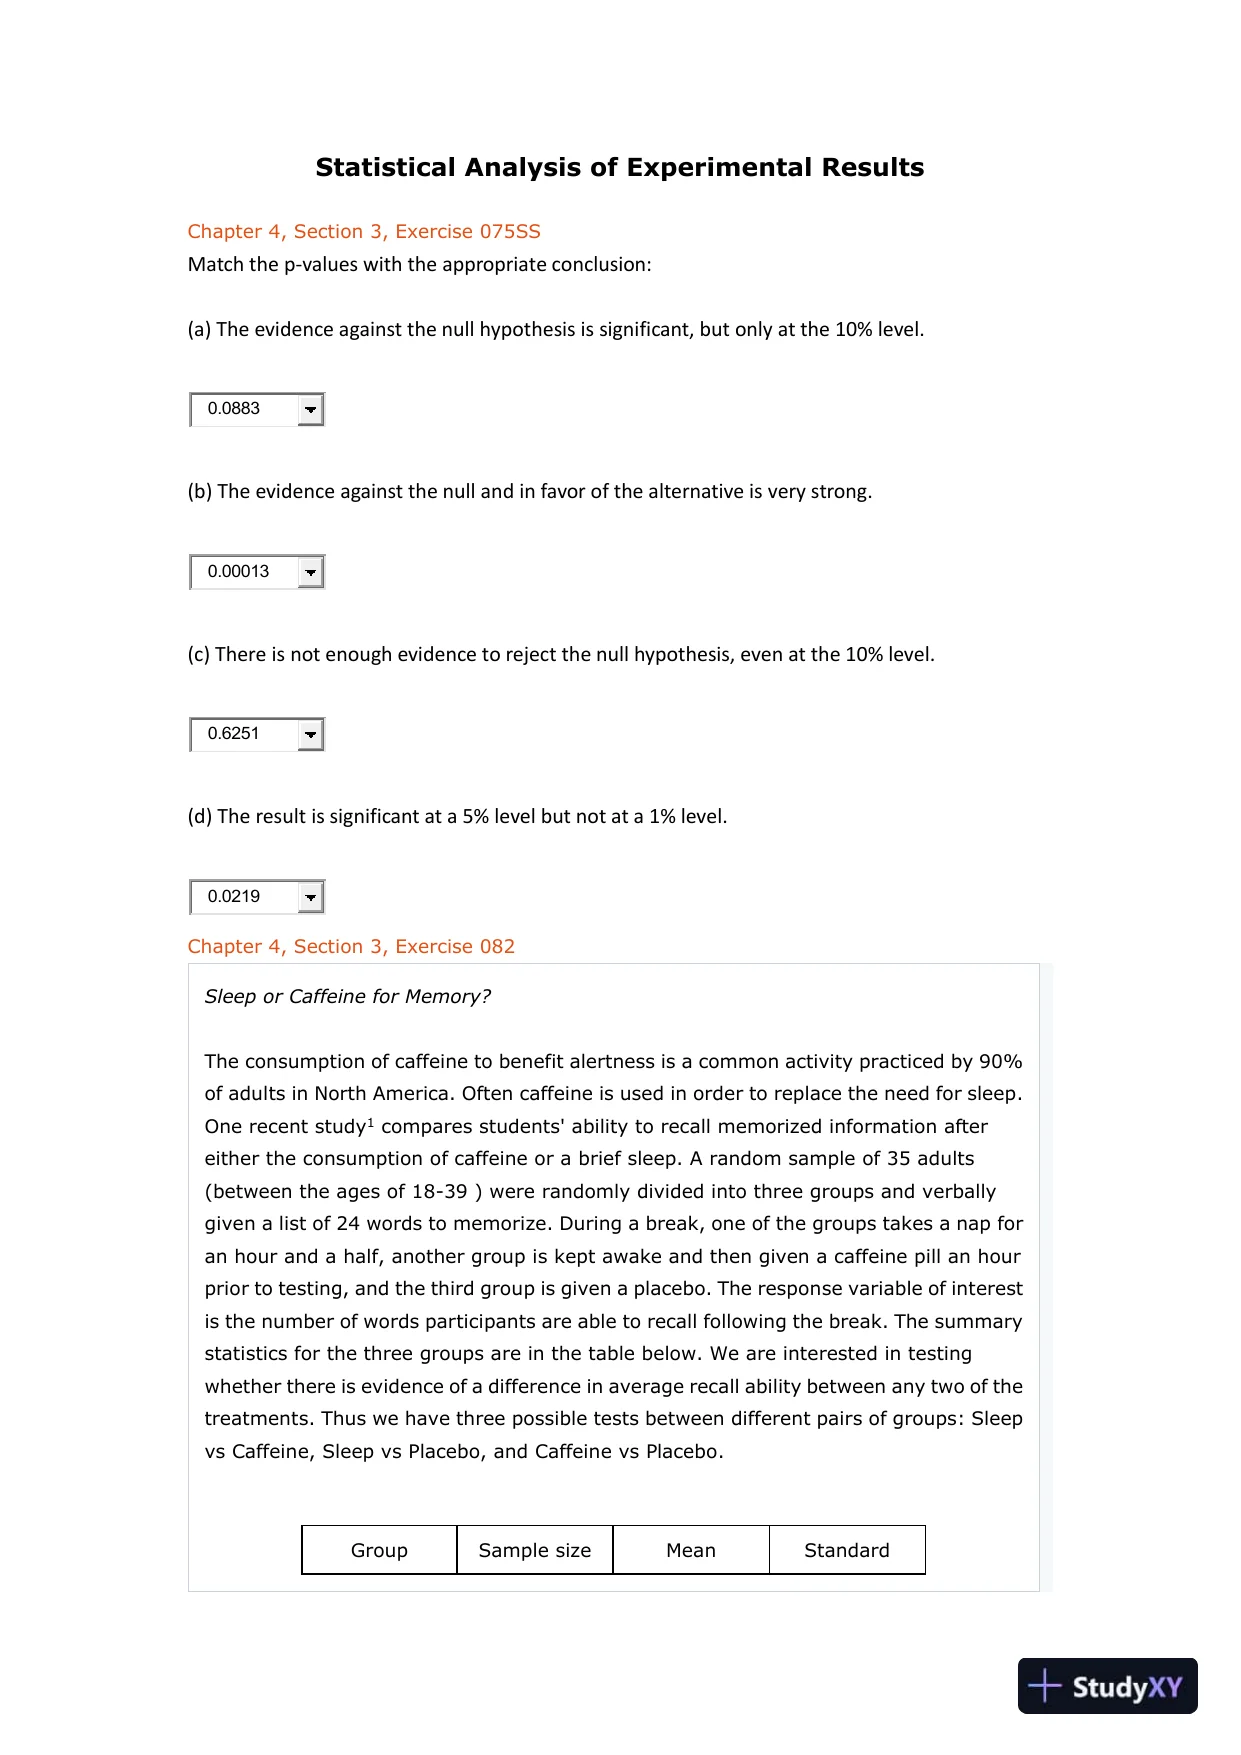
 Statistical Analysis of Experimental ResultsChapter 4, Section 3, Exercise 075SSMatch thep-values with the appropriate conclusion:(a) The evidence against the null hypothesis is significant, but only at the10%level.0.0883(b) The evidence against the null and in favor of the alternative is very strong.0.00013(c) There is not enough evidence to reject the null hypothesis, even at the10%level.0.6251(d) The result is significant at a5%level but not at a1%level.0.0219Chapter 4, Section 3, Exercise 082Sleep or Caffeine for Memory?The consumption of caffeine to benefit alertness is a common activity practiced by90%of adults in North America. Often caffeine is used in order to replace the need for sleep.One recent study1compares students' ability to recall memorized information aftereither the consumption of caffeine or a brief sleep. A random sample of35adults(between the ages of18-39) were randomly divided into three groups and verballygiven a list of24words to memorize. During a break, one of the groups takes a nap foran hour and a half, another group is kept awake and then given a caffeine pill an hourprior to testing, and the third group is given a placebo. The response variable of interestis the number of words participants are able to recall following the break. The summarystatistics for the three groups are in the table below. We are interested in testingwhether there is evidence of a difference in average recall ability between any two of thetreatments. Thus we have three possible tests between different pairs of groups: Sleepvs Caffeine, Sleep vs Placebo, and Caffeine vs Placebo.GroupSample sizeMeanStandard
Preview Mode
This document has 21 pages. Sign in to access the full document!