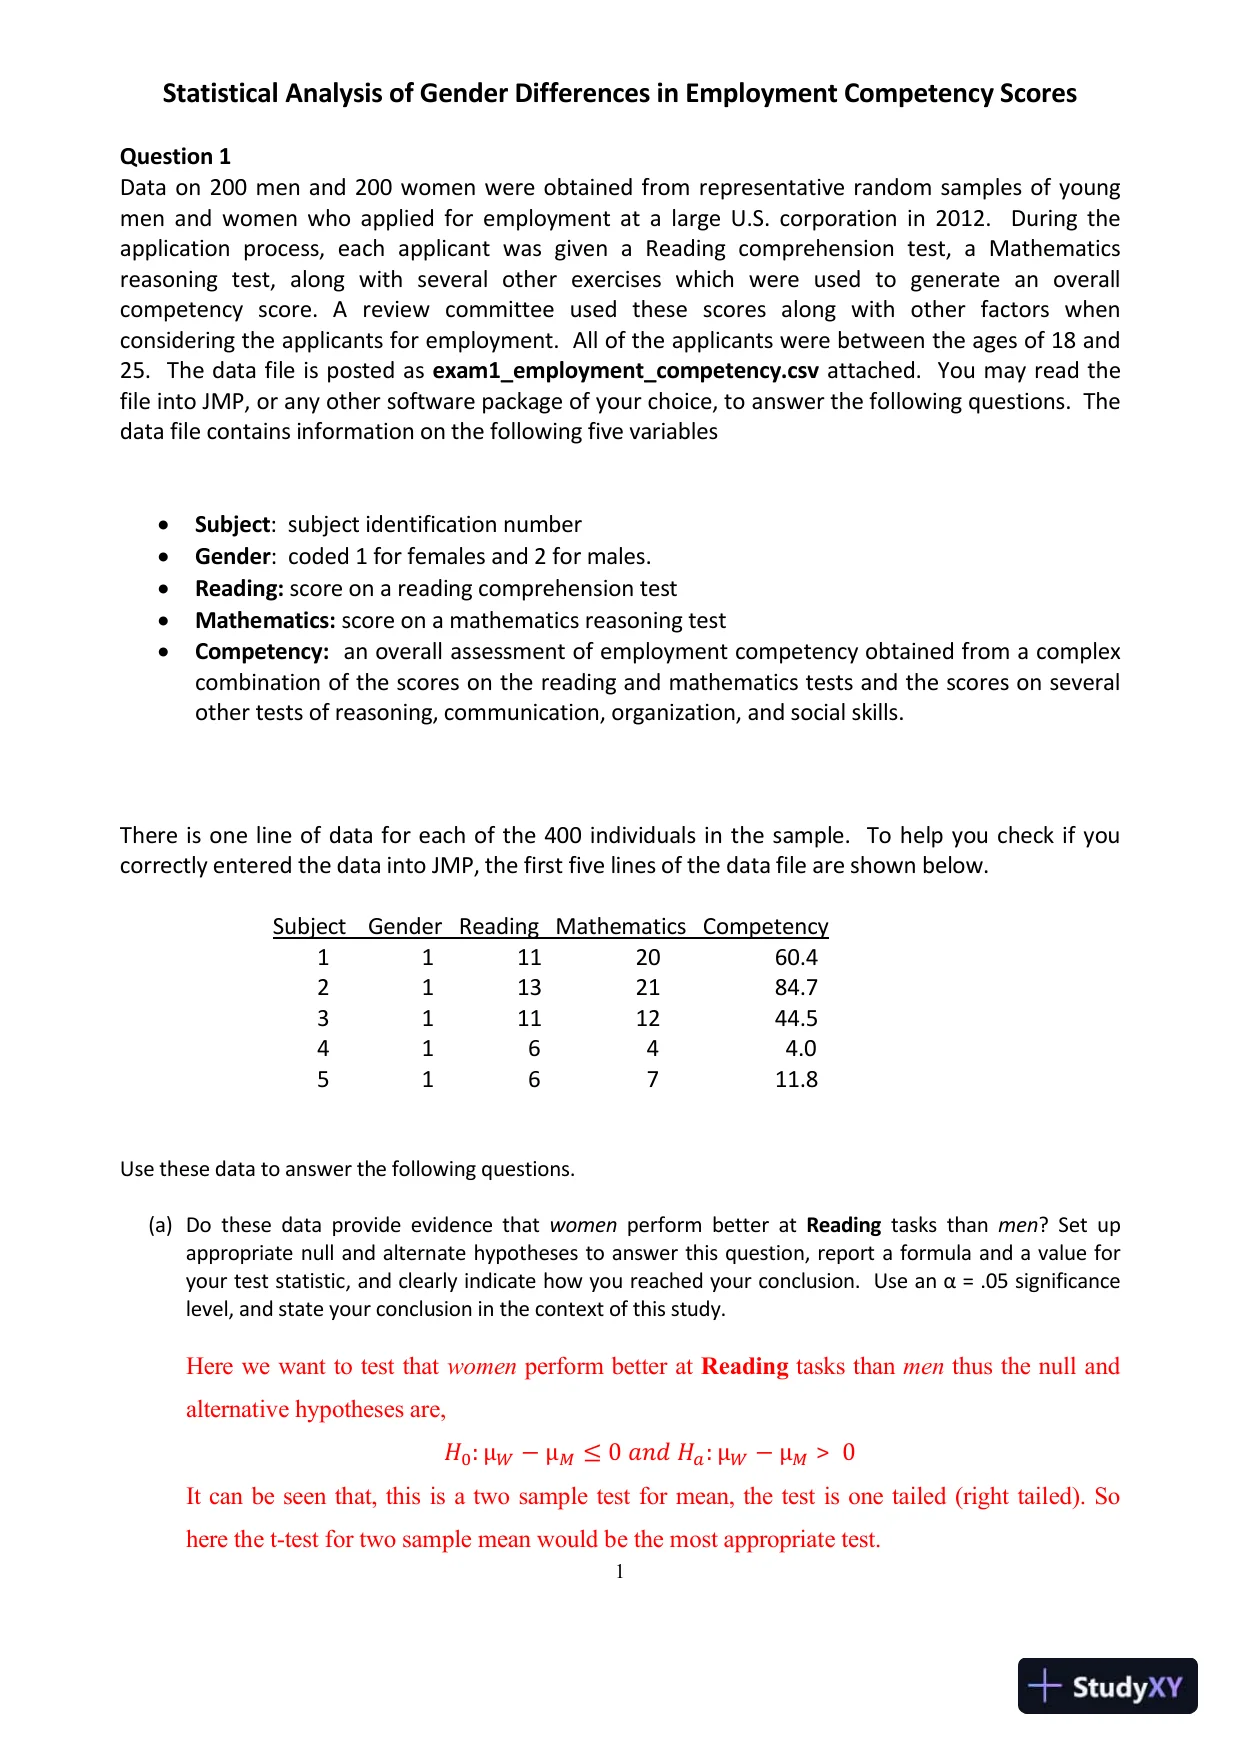
 1Statistical Analysis of Gender Differences in Employment Competency ScoresQuestion 1Data on 200 men and 200 women were obtained from representative random samples of youngmen and women who applied for employment at a large U.S. corporation in 2012.During theapplication process, each applicant was given a Reading comprehension test, a Mathematicsreasoning test, along with several other exercises which were used to generate an overallcompetency score. Areviewcommittee used these scores along with other factors whenconsidering the applicants for employment. All of the applicants were between the ages of 18 and25.The data file is posted asexam1_employment_competency.csvattached.You may read thefile into JMP, or any other software package of your choice, to answer the following questions. Thedata file contains information on the following five variablesSubject: subject identification numberGender: coded 1 for females and 2 for males.Reading:score on a reading comprehension testMathematics:score on a mathematics reasoning testCompetency:an overallassessment of employment competency obtained from a complexcombination of the scores on the reading and mathematics tests and the scores on severalother tests of reasoning, communication, organization, and social skills.There is one line of data for each of the 400 individuals in the sample.To help you check if youcorrectly entered the data into JMP, the first five lines of the data file are shown below.SubjectGenderReadingMathematicsCompetency11112060.421132184.731111244.541644.0516711.8Use these data to answer the following questions.(a)Do these data provide evidence thatwomenperform better atReadingtasks thanmen? Set upappropriate null and alternate hypotheses to answer this question, report a formula and avalue foryour test statistic, and clearly indicate how you reached your conclusion. Use anα= .05 significancelevel, and state your conclusion in the context of this study.Here we want to test thatwomenperform better atReadingtasks thanmenthus the null andalternative hypotheses are,𝐻0:μௐ−μெ≤0𝑎𝑛𝑑𝐻𝑎:μௐ−μெ>0It can be seen that, this is a two sample test for mean, the test is one tailed (right tailed). Sohere the t-test for two sample mean would be the most appropriate test.
Preview Mode
This document has 11 pages. Sign in to access the full document!