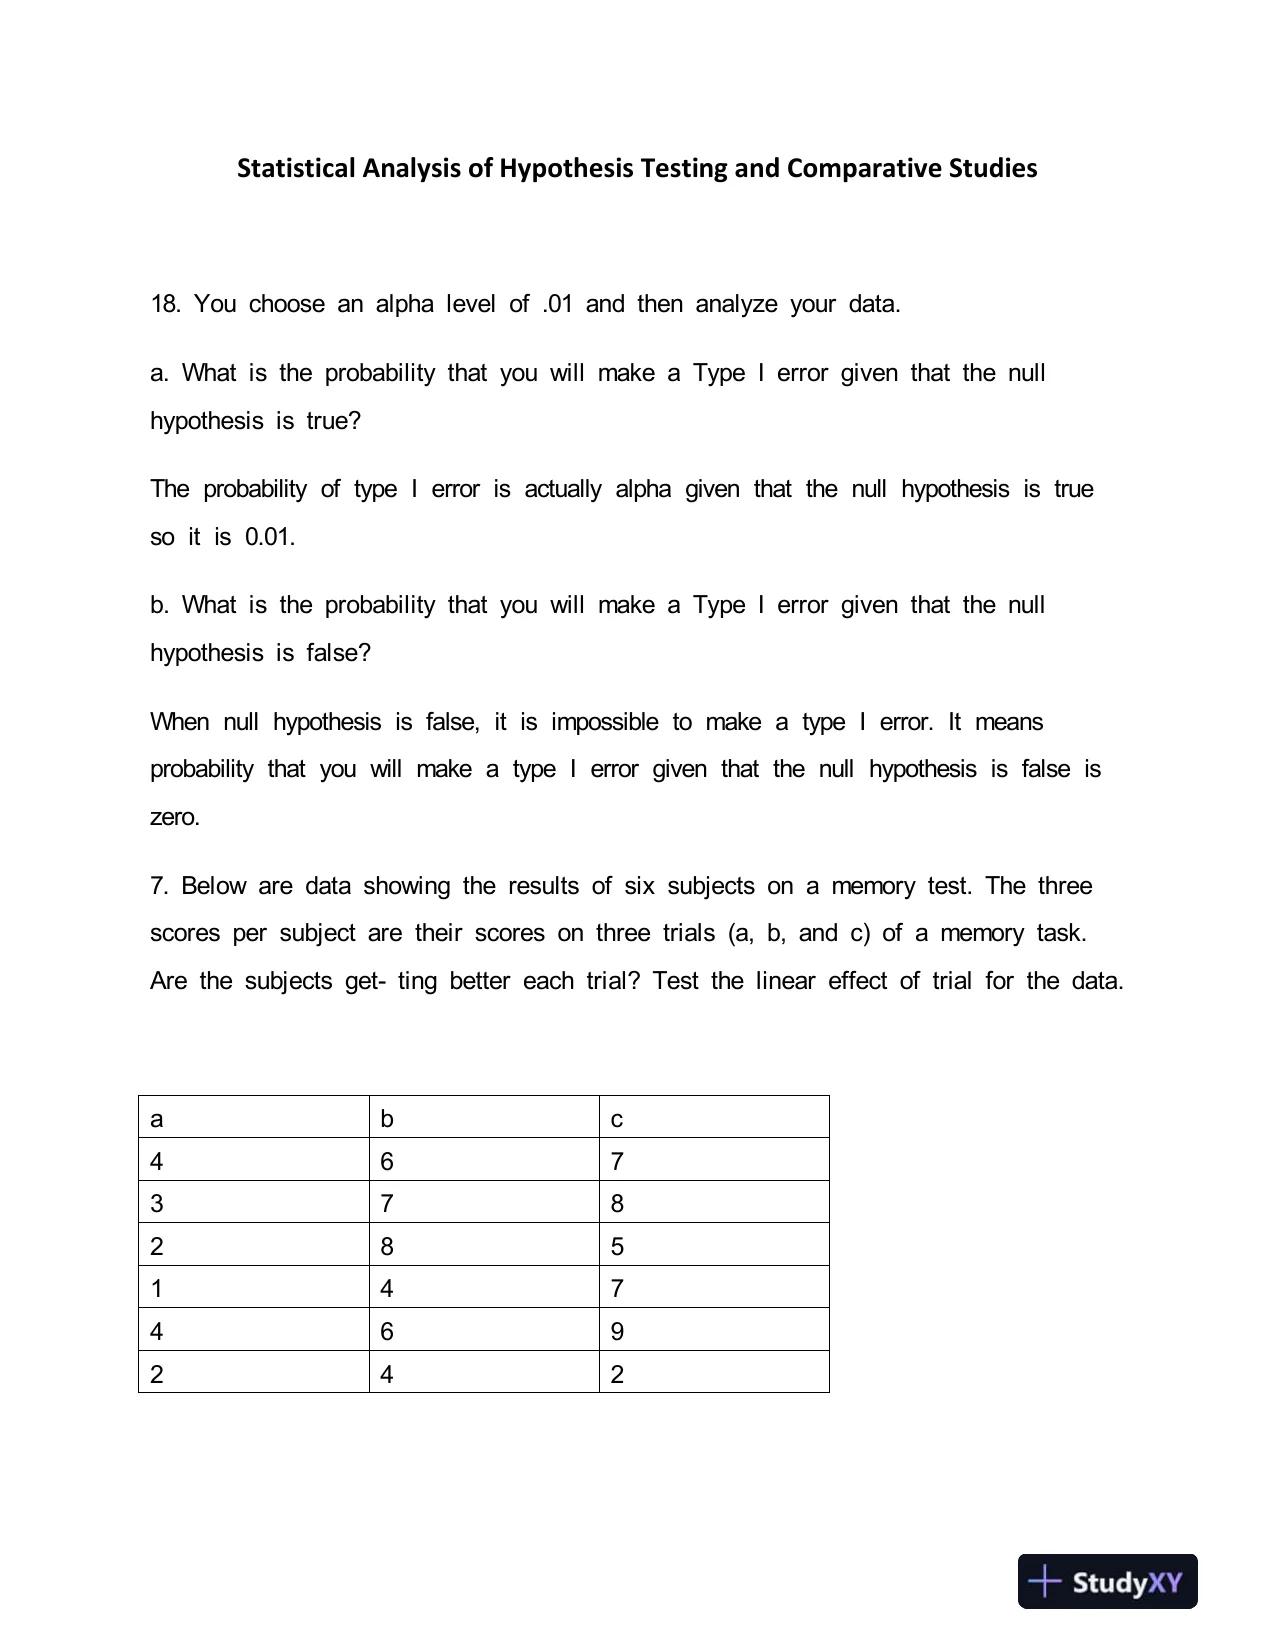
 Statistical Analysis of Hypothesis Testing and Comparative Studies18. You choose an alpha level of .01 and then analyze your data.a. What is the probability that you will make a Type I error given that the nullhypothesis is true?The probability of type I error is actually alpha given that the null hypothesis is trueso it is 0.01.b. What is the probability that you will make a Type I error given that the nullhypothesis is false?When null hypothesis is false, it is impossible to make a type I error. It meansprobability that you will make a type I error given that the null hypothesis is false iszero.7. Below are data showing the results of six subjects on a memory test. The threescores per subject are their scores on three trials (a, b, and c) of a memory task.Are the subjects get-ting better each trial? Test the linear effect of trial for the data.abc467378285147469242
Preview Mode
This document has 8 pages. Sign in to access the full document!