CramX Logo
Statistical Analysis Using ANOVA: Independent and Repeated-Measures Comparisons - Document preview page 1

Statistical Analysis Using ANOVA: Independent and Repeated-Measures Comparisons - Page 1

Document preview content for Statistical Analysis Using ANOVA: Independent and Repeated-Measures Comparisons

Statistical Analysis Using ANOVA: Independent and Repeated-Measures Comparisons

This paper applies ANOVA techniques to statistical analysis, comparing independent and repeated-measures data in research studies.

Alexander Wilson
Contributor
4.9
0
12 months ago
Preview (4 of 13 Pages)
100%
Log in to unlock
Page 1 of 4
Statistical Analysis Using ANOVA: Independent and Repeated-Measures Comparisons - Page 1 preview image
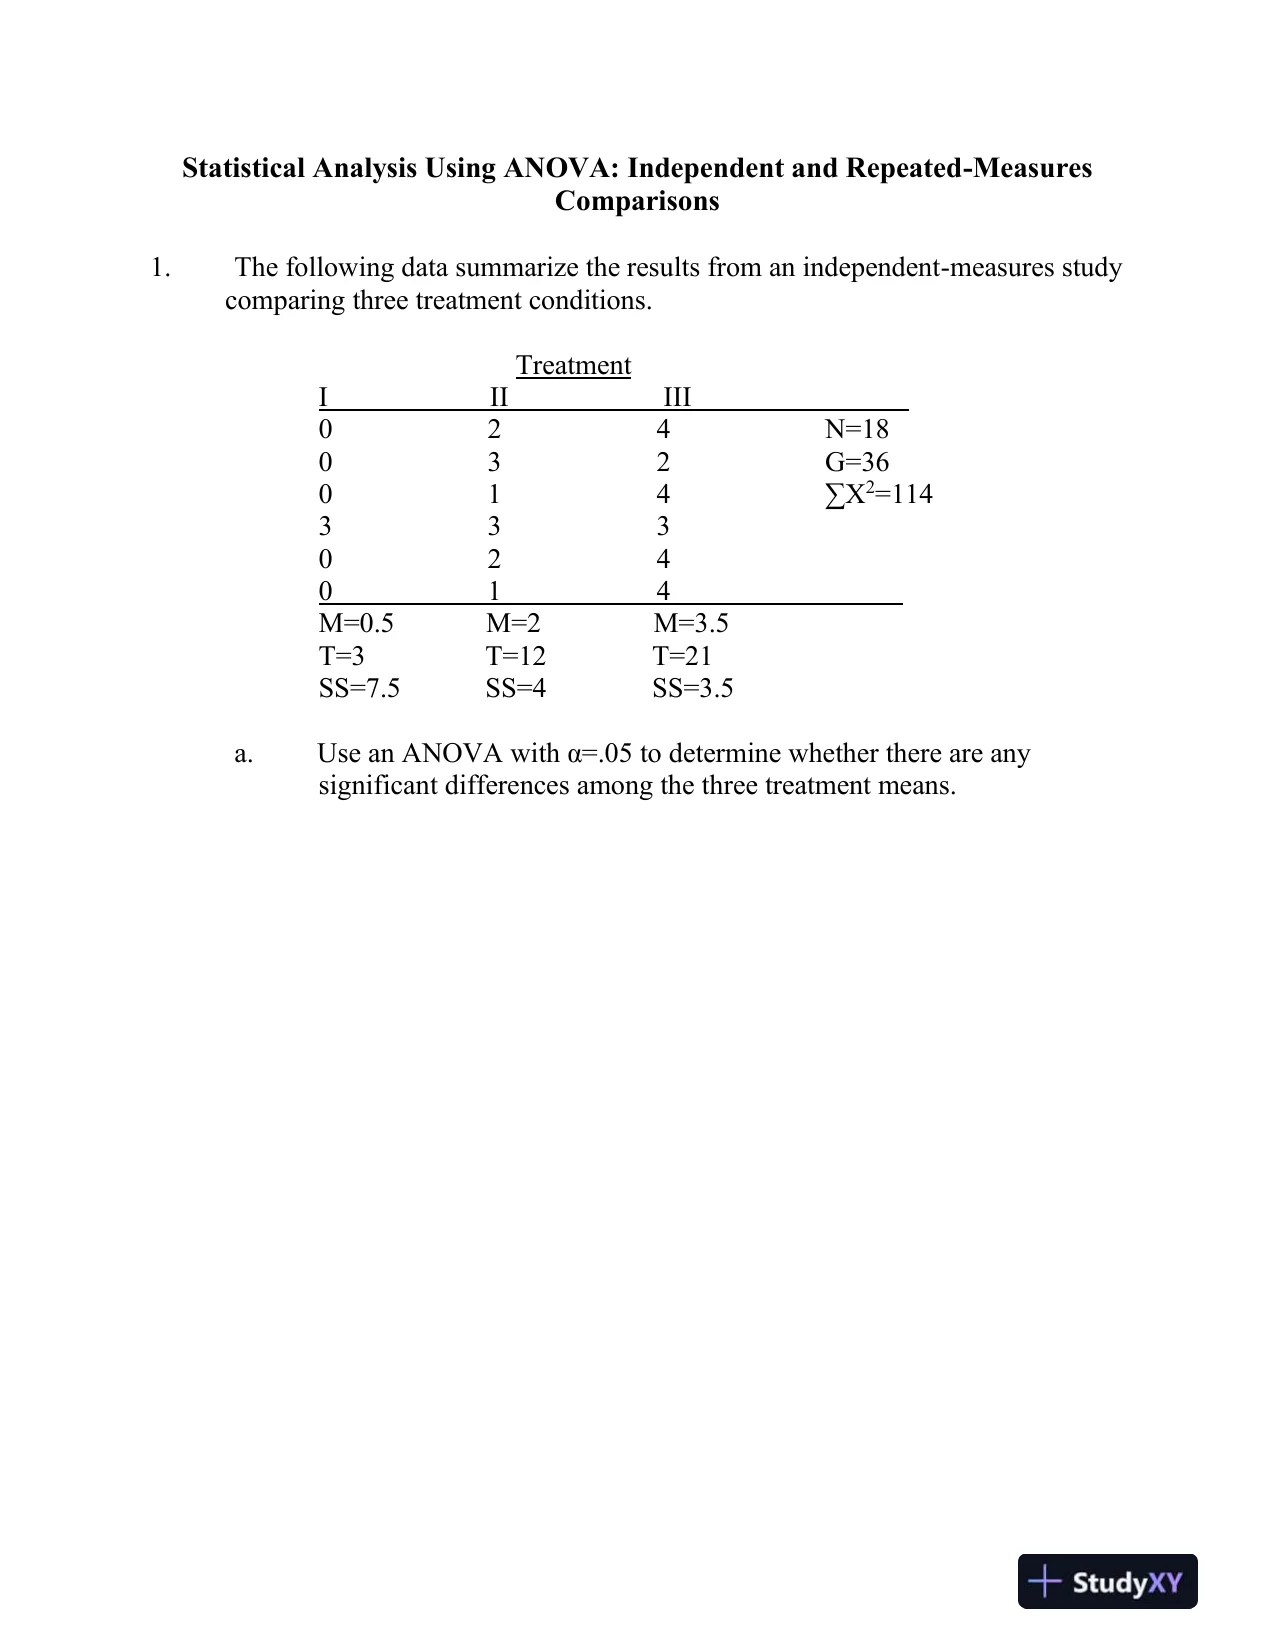
Statistical Analysis Using ANOVA: Independent and Repeated-MeasuresComparisons1.The following data summarize the results from an independent-measures studycomparing three treatment conditions.TreatmentIIIIII024N=18032G=36014∑X2=114333024014M=0.5M=2M=3.5T=3T=12T=21SS=7.5SS=4SS=3.5a.Use an ANOVA with α=.05 to determine whether there are anysignificantdifferences among the three treatment means.
Page 2 of 4
Statistical Analysis Using ANOVA: Independent and Repeated-Measures Comparisons - Page 2 preview image
Page 3 of 4
Statistical Analysis Using ANOVA: Independent and Repeated-Measures Comparisons - Page 3 preview image()01231totalbetweenwithin222totalwithininside each treatmentbetw:vs.: At least one treatment mean differs..05118117131255515361141147242187.543.515HHdfNdfkdfGSSXNSSSSSS==========++=======++=eentotalwithin421527Anova TableSource2713.50Between27213.5013.5021.0015Within15151.0015Total4217SSSSSSdfMSF======The F-critical value at 0.05 level with (2, 15) degrees of freedom is 3.68.Since observedF= 13.50 > 3.68, reject the null hypothesis.Therefore, at 0.05 level data provides sufficient evidence thatthere are significantdifferences among the three treatment means.b.Calculate η2to measure the effect size for this study.2betweentotal270.643 .42SSSS===2.The following data summarize theresults from an independent-measures studycomparing three treatment conditions.TreatmentIIIII410N=12642G=36350∑X2=164722
Page 4 of 4
Statistical Analysis Using ANOVA: Independent and Repeated-Measures Comparisons - Page 4 preview imageM=5M=3M=1T=20T=12T=4SS=10SS=10SS=4a.Calculate the sample variances for each of the three samples.2111222223331010Sample variance of treatment I,3.33 .14131010Sample variance of treatment II,3.33 .141344Sample variance of treatment III,1.33 .1413SSsnSSsnSSsn============b.Use an ANOVA with α=.05 to determine whether there are anysignificantdifferences among the threetreatment means.01231:vs.: At least one treatment mean differs..05HH===()totalbetweenwithin222totalwithininside each treatmentbetweentotalwithin112111131233393616416410856181010424562432Anova TableSourceBetweendfNdfkdfGSSXNSSSSSSSSSSSSdfMSF=======++=======++====3216.0032216.006.0022.6724Within2492.679Total5611===The F-critical value at 0.05 level with (2,9) degrees of freedom is4.26.
Preview Mode

This document has 13 pages. Sign in to access the full document!