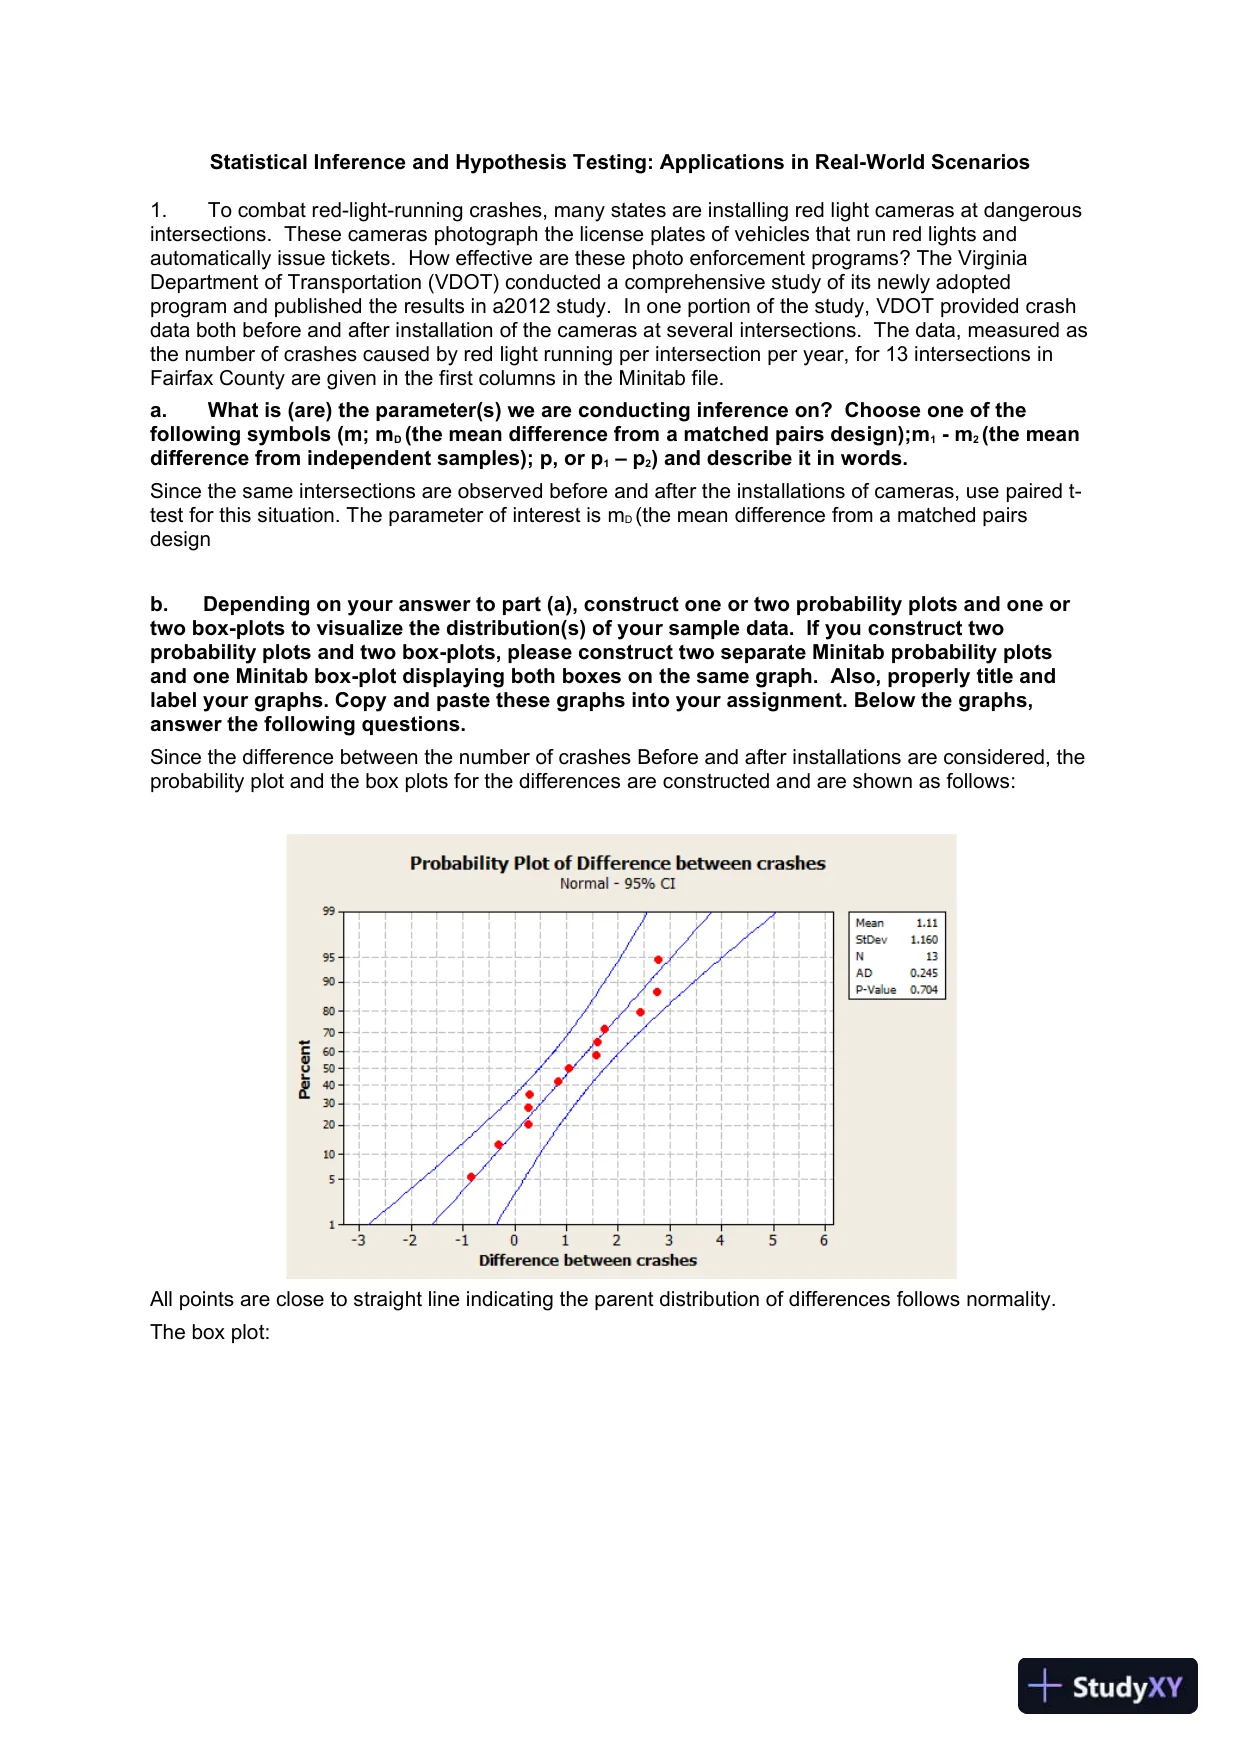
 Statistical Inference and Hypothesis Testing: Applications in Real-World Scenarios1.Tocombat red-light-running crashes, many states are installing red light camerasat dangerousintersections.Thesecameras photograph the license plates ofvehicles that run red lights andautomatically issue tickets.Howeffective are these photo enforcement programs?The VirginiaDepartment of Transportation (VDOT) conducted acomprehensive study of its newly adoptedprogram and published the results in a2012 study.In one portion of the study,VDOT provided crashdata both before and after installation of the cameras atseveral intersections.The data,measured asthe number of crashes caused by red light running per intersectionper year, for 13 intersections inFairfax County are given in the first columnsin the Minitab file.a.What is (are) the parameter(s) we are conducting inference on?Choose one of thefollowing symbols (m; mD(the mean difference from a matched pairs design);m1-m2(the meandifference from independent samples); p, or p1–p2) and describe it in words.Since the same intersections are observed before and after the installations of cameras, use paired t-test for this situation. The parameter of interest ismD(themeandifference from a matched pairsdesignb.Depending on your answer to part (a), construct one or two probability plots and one ortwo box-plots to visualize the distribution(s) of your sample data.If you construct twoprobability plots and two box-plots, please construct two separate Minitab probability plotsand one Minitab box-plot displaying both boxes on the same graph.Also, properly title andlabel your graphs. Copy and paste these graphs into your assignment.Below the graphs,answer the following questions.Since the difference between the number of crashes Before and after installations are considered, theprobability plot and the box plots for the differences are constructed and are shown as follows:All points are close to straight line indicating the parent distribution of differences follows normality.The box plot:
Preview Mode
This document has 12 pages. Sign in to access the full document!