Statistical Methods and Analysis: A Comprehensive Assessment

Comprehensive review of statistical analysis techniques and their applications.

Caleb Patterson
Contributor
4.6
42
10 months ago
Preview (5 of 14 Pages)
100%
Log in to unlock

Page 1

Statistical Methods and Analysis: A Comprehensive Assessment - Page 1 preview image

Loading page ...

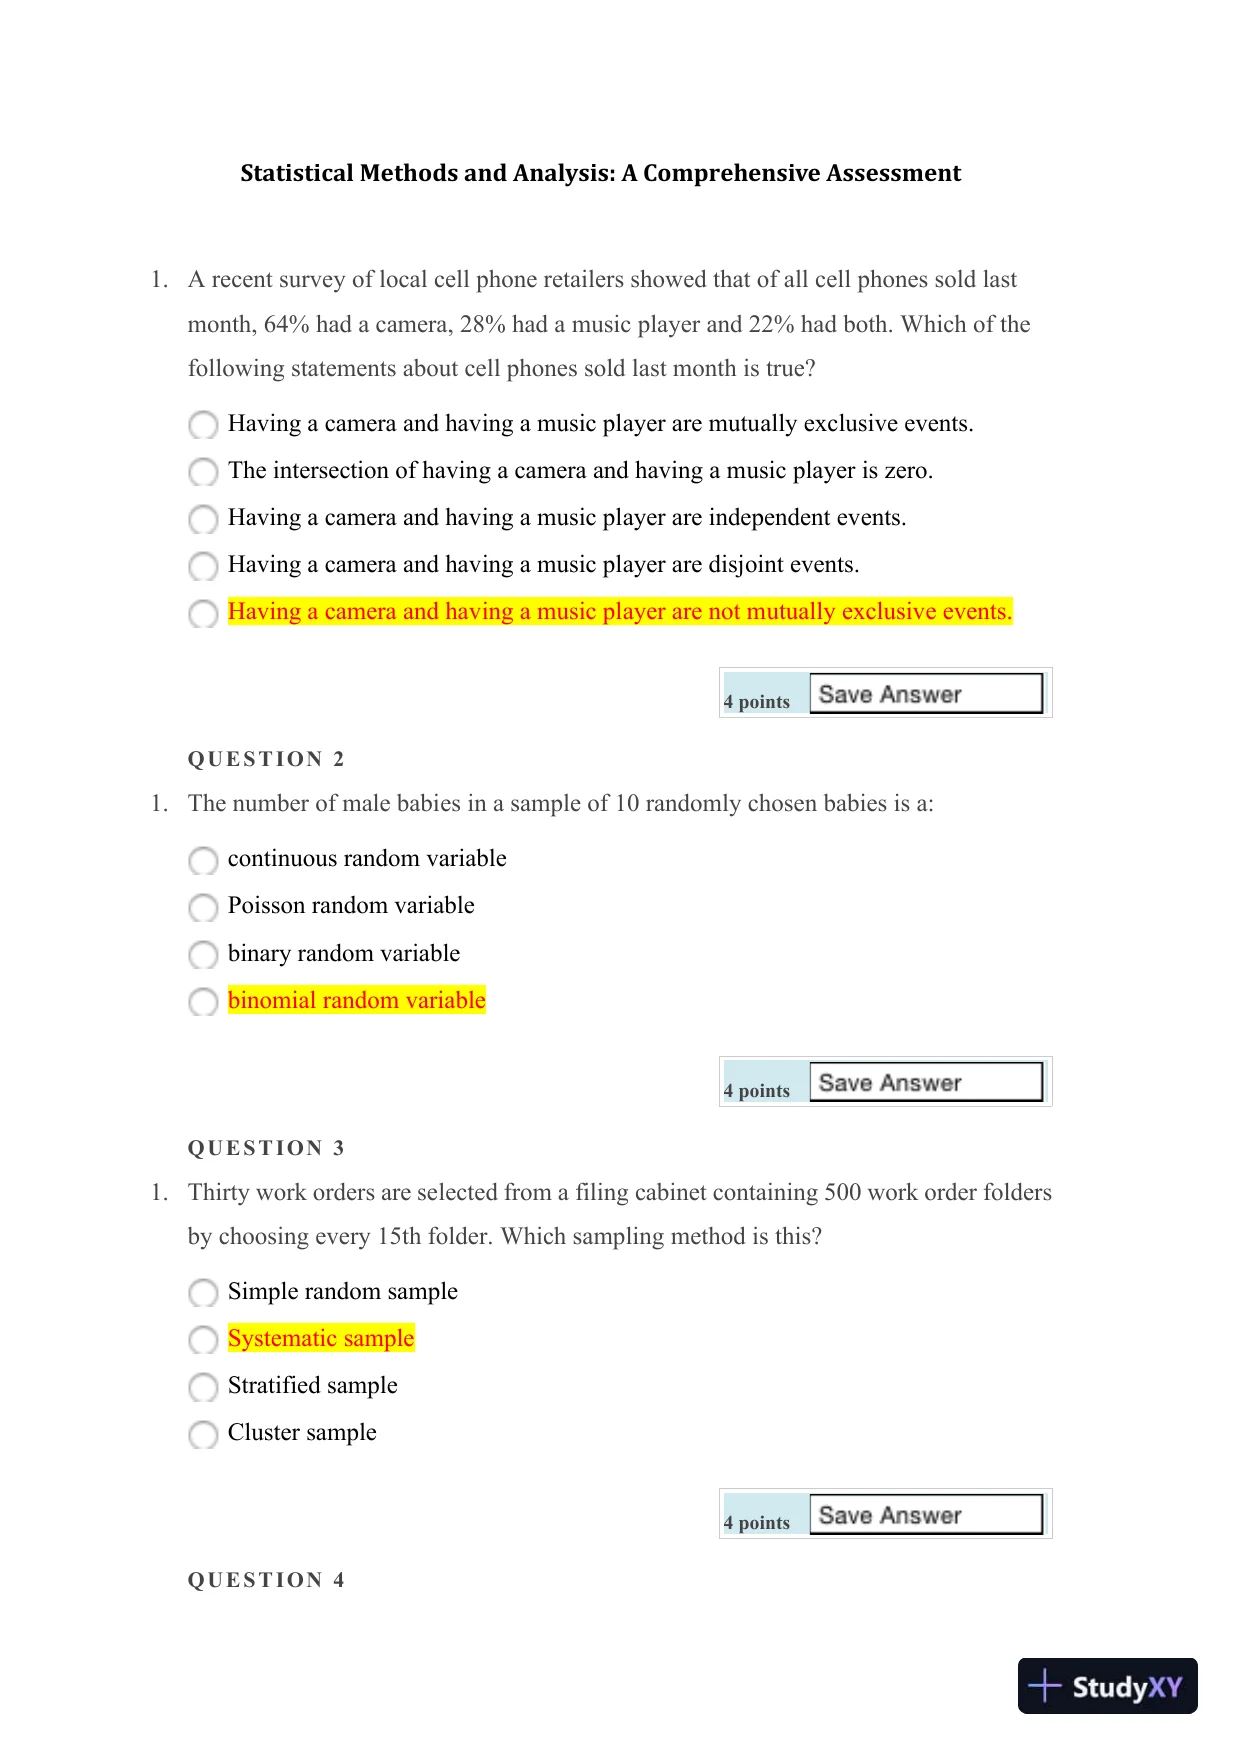
Statistical Methods and Analysis: A Comprehensive Assessment1.A recent survey of local cell phone retailers showed that of all cell phones sold lastmonth, 64% had a camera, 28% had a music player and 22% had both. Which of thefollowingstatements about cell phones sold last month is true?Having a camera and having a music player are mutually exclusive events.The intersection of having a camera and having a music player is zero.Having a camera and having a music player are independent events.Having a camera and having a music player are disjoint events.Having a camera and having a music player are not mutually exclusive events.4pointsQ U E S T I O N 21.The number of male babies in a sample of 10 randomly chosen babies is a:continuous random variablePoisson random variablebinary random variablebinomial random variable4pointsQ U E S T I O N 31.Thirty work orders are selected from a filing cabinet containing 500 work order foldersby choosing every 15thfolder. Which sampling method is this?Simple random sampleSystematic sampleStratified sampleCluster sample4pointsQ U E S T I O N 4

Page 2

Statistical Methods and Analysis: A Comprehensive Assessment - Page 2 preview image

Loading page ...

Page 3

Statistical Methods and Analysis: A Comprehensive Assessment - Page 3 preview image

Loading page ...

1.A sample of 250 people resulted in a confidence interval estimate for the proportion ofpeople who believe that thefederal government's proposed tax increase is justified isbetween 0.14 and 0.20. Based on this information, what was the confidence level usedin this estimation?Approximately 1.5995 percentApproximately 79 percentCan't be determined without knowingσ(sigma).4pointsQ U E S T I O N 51.A 99% confidence interval estimate can be interpreted to mean thatif all possible samples are taken and confidence interval estimates are developed,99% of them would include the true population meansomewhere within theirinterval.we have 99% confidence that we have selected a sample whose interval doesinclude the population mean.both of the above.none of the above.4pointsQ U E S T I O N 61.At the U.S. Open Tennis Championship a statistician keeps track of every serve that aplayer hits during thetournament. The statistician reported that the mean serve speed ofa particular player was 105 miles per hour (mph) and the standard deviation of the servespeeds was 9 mph. If nothing is known about the shape of the distribution, give aninterval that will contain the speeds of at least eight-ninths of the player's serves.87 mph to 123 mph132 mph to 159 mph69 mph to 141 mph

Page 4

Statistical Methods and Analysis: A Comprehensive Assessment - Page 4 preview image

Loading page ...

78 mph to 132 mph4pointsQ U E S T I O N 71.Chebychev's Theorem:applies to all samplesapplies only to samples from a normal populationgives a narrower range of predictions than the Empirical Ruleis based on Sturges' Rule for data classification4pointsQ U E S T I O N 81.A major department store chain isinterested in estimating the average amount its credit card customersspent on their first visit to the chain’s new store in the mall. Fifteen credit card accounts were randomlysampled and analyzed with the following results:X(i.e. Xbar= $50.50) ands2(i.e. s squared = 400).Assuming the distribution of the amount spent on their first visit is approximately normal, what is theshape of the sampling distribution of the sample mean that will be used to create the desired confidenceinterval forμ(mew)?Approximately normal with a mean of $50.50A standard normal distributionAtdistribution with 15 degrees of freedomAtdistribution with 14 degrees of freedom4pointsQ U E S T I O N 91.As part of an economics class project, students were asked to randomly select 500 NewYork Stock Exchange (NYSE) stocks from the Wall Street Journal. As part of theproject, students were asked to summarize the current prices (also referred to as the

Page 5

Statistical Methods and Analysis: A Comprehensive Assessment - Page 5 preview image

Loading page ...

closing price of the stock for a particular trading date) of the collected stocks usinggraphical and numerical techniques. Identify the sample of interest for this study.the current price (or closing price) of a NYSE stockthe entire set of stocks that are traded on the NYSEa single stock traded on the NYSEthe 500 NYSE stocks thatcurrent prices were collected from4pointsQ U E S T I ON 1 01.A standardized test has a mean score of 500 points with astandard deviation of100 points. Five students' scores are shown below.adam575beth 690carlos 750doug 280 ella 440Which of the students have scores within two standard deviations of the mean?Carlos, DougAdam, BethAdam, Beth, EllaAdam, Beth, Carlos, Ella4pointsQ U E S T I ON 1 11.Suppose a sample ofn= 50 items is drawn from a population of manufactured products and theweight,X, of eachitem is recorded. Prior experience has shown that the weight has a probabilitydistribution withμ= 6 ounces (mew = 6 ounces) andσ= 2.5 ounces (sigma = 2.5 ounces). Which ofthe following is true about the sampling distribution of the sample mean if a sample of size 15 isselected?The mean of the sampling distribution is 6 ounces.The standard deviation of the sampling distribution is 2.5 ounces.
Preview Mode

This document has 14 pages. Sign in to access the full document!