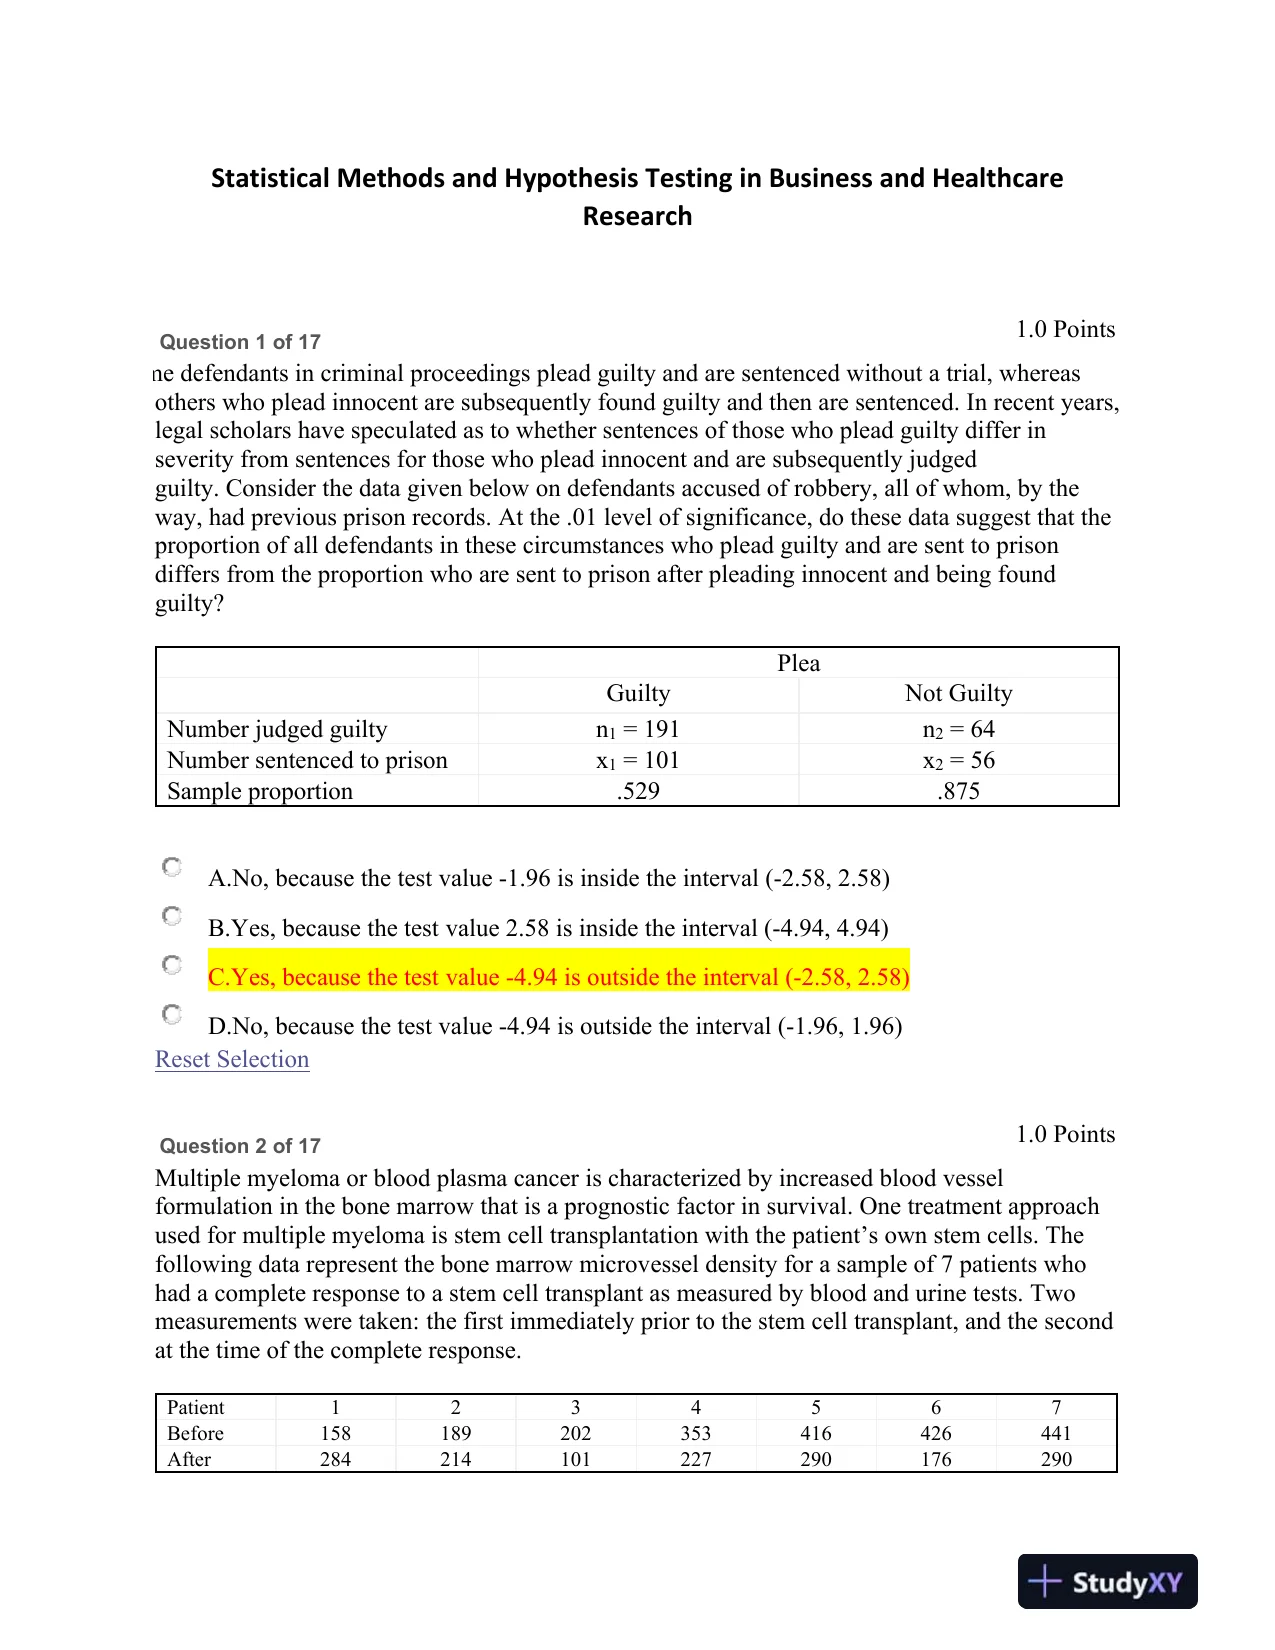
 Statistical Methods and Hypothesis Testing in Business and HealthcareResearchQuestion 1 of 171.0 PointsSome defendants in criminal proceedings plead guilty and are sentenced without a trial, whereasothers who plead innocent aresubsequently found guilty and then are sentenced.In recent years,legal scholars have speculated as to whether sentences of those who plead guilty differ inseverity from sentences for those who plead innocent and are subsequently judgedguilty.Consider the data given below on defendants accused of robbery, all of whom, by theway, had previous prison records.At the .01 level of significance, do these data suggest that theproportion of all defendants in these circumstances who plead guilty and are sentto prisondiffers from the proportion who are sent to prison after pleading innocent and being foundguilty?PleaGuiltyNot GuiltyNumber judged guiltyn1= 191n2= 64Number sentenced to prisonx1= 101x2= 56Sample proportion.529.875A.No, because the test value-1.96 is inside the interval (-2.58, 2.58)B.Yes, because the test value 2.58 is inside the interval (-4.94, 4.94)C.Yes, because the test value-4.94 is outside the interval (-2.58, 2.58)D.No, because thetest value-4.94 is outside the interval (-1.96, 1.96)Reset SelectionQuestion 2 of 171.0 PointsMultiple myeloma or blood plasma cancer is characterized by increased blood vesselformulation in the bone marrow that is a prognostic factor in survival.One treatment approachused for multiple myeloma is stem cell transplantation with the patient’s own stem cells.Thefollowing data represent the bone marrow microvessel density for a sample of 7 patients whohad a complete response to a stem cell transplant as measured by blood and urine tests.Twomeasurements were taken:the first immediately prior tothe stem cell transplant, and the secondat the time of the complete response.Patient1234567Before158189202353416426441After284214101227290176290
Preview Mode
This document has 10 pages. Sign in to access the full document!