CramX Logo
Statistics Alive!, Student, Study Guide Edition Solution Manual - Document preview page 1

Statistics Alive!, Student, Study Guide Edition Solution Manual - Page 1

Document preview content for Statistics Alive!, Student, Study Guide Edition Solution Manual

Statistics Alive!, Student, Study Guide Edition Solution Manual

Statistics Alive!, Student, Study Guide Edition Solution Manual makes studying more efficient with well-organized textbook notes.

Lily Green
Contributor
4.6
0
12 months ago
Preview (16 of 101 Pages)
100%
Log in to unlock
Page 1 of 16
Statistics Alive!, Student, Study Guide Edition Solution Manual - Page 1 preview image
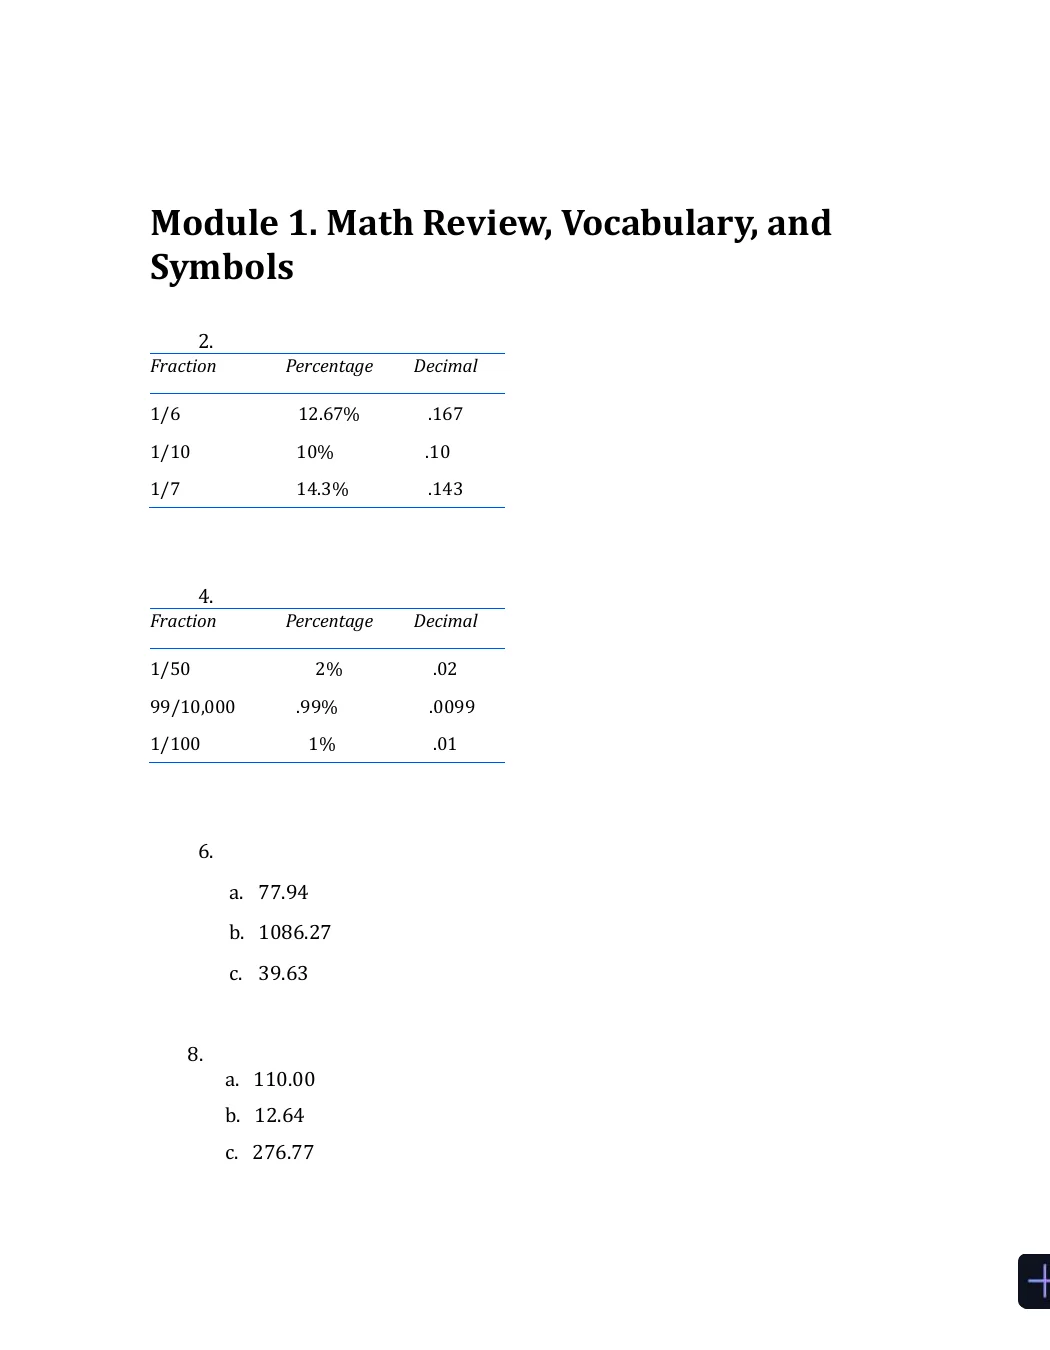
Module 1. Math Review, Vocabulary, andSymbols2.FractionPercentageDecimal1/612.67%.1671/1010%.101/714.3%.1434.FractionPercentageDecimal1/502%.0299/10,000.99%.00991/1001%.016.a.77.94b.1086.27c.39.638.a.110.00b.12.64c.276.77
Page 2 of 16
Statistics Alive!, Student, Study Guide Edition Solution Manual - Page 2 preview image
Page 3 of 16
Statistics Alive!, Student, Study Guide Edition Solution Manual - Page 3 preview image10.a.245 (32)(4)(5)(6)120==b.(4)(5 + 3 × 2) = (4)(5 + 6) = (4)(11) = 44c.45(32)=(2)(5)+6=10+6=16+d.42(5 + 3 × 2) = 16(5 + 6) = (16)(11) = 176e.(4)(8)(22) = (32)(4)= 12812.a.√5*6+6-32-2 = 5b.(4+72-17)/6 = 6c.6-2*2+9/3 = 5d.100-10*5-5 = 45e.√(2-8)*16-2 = 614.a.98(75)(1/3) = 9825 = 73b..672 + (2)(1/6) = .672 + .333 = 1.005=1.00c.(1/3) + (5)(1/4) = 2.667 + 1.25 = 3.917=3.9216.a..155 + 5/2 = .155 + (5) (1/2) = .155 + 2.5 = 2.655b.3.28-3/2 = 3.28(3) (1/2) = 3.281.5 = 4.78c.720/9-45 = (720) (1/9)45 = 8045 = 3518.
Page 4 of 16
Statistics Alive!, Student, Study Guide Edition Solution Manual - Page 4 preview imagea.b+ 20 = .5b= .520b=19.5b.F= 1.8C+ 32F32 = 1.8C(F32)/1.8 =C. . . OR . . .C= (F32)/1.8c.50 = 60/a50a= 60a= 60/50a= 1.220.a.7 =.5b +2.514 = b + 5b = 9b. 64 = 4cc = 16c. 3a = .25Va = (.25V)/322.a.(1 +N) =N1 + (N)(N) =N+N2b.(2X+Y) = 2X+Yc.(aX)2=(a2X2) =Na2X2
Page 5 of 16
Statistics Alive!, Student, Study Guide Edition Solution Manual - Page 5 preview imageModule 2. Measurement Scales2.a.Eye color = Nb.Time to solve a puzzle = Rc.Genre of favorite TV show = Nd.Level of depression = Ie.Position in starting lineup = O4.a.Favorite radio station = Nb.How much sleep you had last night = Rc.How many calories you ate today = Rd.Athletic ability = Ie.Position in graduation processional = O6.a.Type of disease = Nb.Business profit = Rc.Pass or fail status = Nd.Conscientiousness = Ie.Car brands = N8.a.Hair length = C
Page 6 of 16
Statistics Alive!, Student, Study Guide Edition Solution Manual - Page 6 preview imageb.Yearly income = Cc.How much sleep you had last night = Cd.How many calories you ate today = Ce.Athletic ability = C10.a.Amount of irritation you felt today = Cb.Number of times you felt irritated today = Dc.How many different ice cream flavors you’ve tasted = Dd.How much weight you have gained or lost in the past year = Ce.How badly you need a vacation right now = C12.a.GPA = 3.153.25b.Test score = 82.583.5c.Miles to work = 1525d.Feet of snow = 3.1253.375e.Shoe size = 101/2111/214.a.IQ = 115.75116.25b.Height = 66.4566.55c.Age = 19.520.5d.Driving speed = 5565e.Olympic performance = 9.6959.705
Page 7 of 16
Statistics Alive!, Student, Study Guide Edition Solution Manual - Page 7 preview imageModule 3. Frequency and Percentile Tables2.Classes MissedFrequencyCumulative Frequency8132513143303427292319140554.Number TV SetsFrequencyCumulative Frequency51254224352229171680226.
Page 8 of 16
Statistics Alive!, Student, Study Guide Edition Solution Manual - Page 8 preview imageClasses MissedFrequencyRel. FrequencyCum. Rel. Frequency81.031251.0051.03125.9687543.09375.9375034.12500.8437529.28125.7187519.28125.4375005.15625.156258.Number TV SetsFrequencyCumulative FrequencyPercentCum. Percent51254.0100.042248.096.0352220.088.0291736.068.016824.032.00228.08.010.a.SecondFrequency110119110010929099180890
Page 9 of 16
Statistics Alive!, Student, Study Guide Edition Solution Manual - Page 9 preview image707926069550591404943039320291b.SecondFrequency11112519611038195066805516533650620352c.SecondFrequency100119380991607974059520394d.The 20-s interval gives the clearest picture of the data.
Page 10 of 16
Statistics Alive!, Student, Study Guide Edition Solution Manual - Page 10 preview image12.a.b.c.2-Spam Interval5-Spam Interval10-SpamIntervalNo. SpamsFreqNo. SpamsFreqNo.SpamsFreq26-27125-29120-29424-25120-24310-19722-23115-1950-91920-21110-14218-1915-9716-1720-41214-15212-13110-1118-926-724-562-370-12d. The 5-spam interval seems most informative. The 10-spam interval might also beinformative. The 2-spam interval is not informative.14.The 75th percentile rank has 75% of the scores at or below that score. In a set of50 scores, that would be (.75)(50) = the 37.5th score. Counting up from thebottom of the table, the 37.5th score is approximately 88. Using theformula, the score is
Page 11 of 16
Statistics Alive!, Student, Study Guide Edition Solution Manual - Page 11 preview imageP(75)= 87.5 + (1/3)(3734)(.5)P(75)= 87.5 + (1/3)(3)(.5)P(75)= 87.5 + 1(.5)P(75)= 87.5 + .5P(75)= 8816. Answers will vary.
Page 12 of 16
Statistics Alive!, Student, Study Guide Edition Solution Manual - Page 12 preview imageEven Solutions to Textbook ExercisesModule 4. Graphs and Plots2.a.StemLeaf5860 0 0 2 3 3 6 771 2 2 3 4 6 6 8 8 8 8 984 4 5 6 7 8 890 1b.c.
Page 13 of 16
Statistics Alive!, Student, Study Guide Edition Solution Manual - Page 13 preview image4.a.StemLeaf22,410,1,1,2,2,2,3,4,5,803,4,4,5,5,6,6,7,7,8,8,8,9b.c.
Page 14 of 16
Statistics Alive!, Student, Study Guide Edition Solution Manual - Page 14 preview image6.a. Number of children in American families = PSb. Shoe size for a random sample of men = Nc. Age of residents of a nursing home = NSd. Number of crimes committed by a random sample of citizens = PSe. Percentage of applicants admitted to a highly selective college = PS8.Positively skewed.10.Positively skewed.12.a.b.Blue = 30.59Red = 21.18Green = 17.65Purple = 14.12Pink = 8.24Orange = 4.74Yellow = 3.53
Page 15 of 16
Statistics Alive!, Student, Study Guide Edition Solution Manual - Page 15 preview image14.a.b.16.a.Eye color in your statistics class = B, Pb.Types of tools owned by 50 H.O.H. = B, P
Page 16 of 16
Statistics Alive!, Student, Study Guide Edition Solution Manual - Page 16 preview imagec.Amount of water drunk by dogs = SL, H, Fd.Miles run by racers = SL, H, Fe.Relative positions in a contestant lineup = SL, H, FOR: No graph is appropriate for ordinal scores18.a.A,B,C, or D answers on a multiple choice test answer key = B, Pb.Diagnoses for 100 visitors to a medical clinic = B, Pc.Number of months people dated their future spouse prior to marriage = SL, H, Fd.Number of pictures a digital camera will take before the battery is exhausted = SL, H, Fe.Preferred brand of laundry detergent = B, P
Preview Mode

This document has 101 pages. Sign in to access the full document!